Abstract
The advantages of once-through molten salt reactors include readily available fuel, low nuclear proliferation risk, and low technical difficulty, making them potentially one of the most easily commercialized fuel cycle modes for molten salt reactors. However, there exist certain issues in parameter selection for once-through molten salt reactors, and the relevant burnup optimization work requires further analysis. This study investigated a once-through graphite-moderated molten salt reactor utilizing enriched uranium and thorium. By varying parameters such as fuel volume fraction (VF), initial heavy nuclei concentration (HN0), feed uranium enrichment (EFU), reactor core volume, and fuel type, optimal conditions for burnup were obtained. An optimal region for VF and HN0 was identified in each scheme, with the location and size of this optimal region varying with the degree of EFU, core volume, and fuel type. The recommended core schemes provide a reference for the core design of once-through molten salt reactors.
Full Text
Preamble
Burnup Optimization of Once-Through Molten Salt Reactors Using Enriched Uranium and Thorium
Meng-Lu Tan¹,², Gui-Feng Zhu¹,², Zheng-De Zhang³, Yang Zou¹,², Xiao-Han Yu¹,², Cheng-Gang Yu¹,², Ye Dai¹,², Rui Yan¹,²
¹Shanghai Institute of Applied Physics, Chinese Academy of Sciences, Shanghai 201800, China
²University of Chinese Academy of Sciences, Beijing 100049, China
³Shanghai Jiao Tong University, Shanghai 200240, China
*Corresponding authors: yuxiaohan@sinap.ac.cn; zhuguifeng@sinap.ac.cn
Abstract
Once-through molten salt reactors offer several advantages, including readily available fuel, low nuclear proliferation risk, and reduced technical complexity, making them potentially the most easily commercialized fuel cycle mode for molten salt reactors. However, parameter selection for once-through molten salt reactors presents certain challenges, and further analysis is required for burnup optimization. This study investigated a once-through graphite-moderated molten salt reactor fueled with enriched uranium and thorium. We varied the fuel volume fraction (VF), initial heavy nuclei concentration (HN₀), feeding uranium enrichment (EFU), reactor core volume, and fuel type to identify optimal burnup conditions. An optimal region for VF and HN₀ was identified for each scheme, with the location and size of this region shifting according to EFU, core volume, and fuel type. The recommended core schemes provide valuable references for the core design of once-through molten salt reactors.
Keywords: Once-through fuel cycle; Molten salt reactor; Enriched uranium; Thorium
1 Introduction
As a fourth-generation reactor system, molten salt reactors (MSRs) offer inherent safety features, eliminate the risk of core meltdown, and enable online fuel feeding and reprocessing \cite{1}. MSRs do not require fuel rod manufacturing, substantially reducing fuel production costs. Online feeding and fuel reprocessing facilitate the continuous removal of fission products and the separation and extraction of actinides, thereby improving neutron economy \cite{2,3}. The large negative temperature reactivity coefficient and void reactivity coefficient of the fuel salt ensure passive safety, while a passive core drain system further enhances MSR safety \cite{4}.
Fuel chemical reprocessing is often complex, highly hazardous, and potentially poses significant proliferation risks. Consequently, once-through MSRs using low-enriched uranium (LEU) and thorium have attracted worldwide interest \cite{5-7}. The once-through fuel cycle design excludes chemical reprocessing of spent fuel, meaning uranium and plutonium are not recycled \cite{8,9}. This design is relatively simple, offering advantages of easy fuel availability, low proliferation risk, and reduced technical difficulty. It would significantly decrease capital investment as well as research, development, and operating costs, and is expected to achieve commercial deployment at the earliest opportunity. The once-through MSR concept was first proposed by Oak Ridge National Laboratory (ORNL) in the 1970s as the Denatured Molten Salt Reactor (DMSR) \cite{10}, characterized by its simple structure, low reprocessing difficulty, and excellent nonproliferation performance \cite{11}.
Several reactor designs, including ThorCon \cite{12}, the Integral Molten Salt Reactor (IMSR) \cite{13}, and the small modular Thorium-based molten salt reactor (sm-TMSR) \cite{14,15}, have proposed individual design schemes to accelerate MSR deployment in the next decade.
Research on MSRs over the past two decades has primarily focused on breeder reactors \cite{16-19}. In breeder MSRs, ²³³U serves as the fissile fuel salt while thorium acts as the fertile breeder salt. After reprocessing, ²³³U is returned to the reactor online and thorium is replenished \cite{20,21}. However, once-through MSRs are typically initiated with enriched uranium with or without thorium. They usually adopt gradual fuel feeding without online reprocessing, removing only fission gases to enable continuous reactor operation \cite{22}. Due to differences in fuel type and cycle mode, burnup, conversion ratios, neutron spectra, and optimal parameter regions differ between once-through MSRs and breeder MSRs. Online fuel feeding also introduces new challenges, such as heavy metal accumulation in the reactor core \cite{23}, necessitating further study of burnup analysis and nuclear design parameters for once-through MSRs.
Even within the once-through mode, selection issues persist under different requirements. Without breeding considerations, NaF-BeF₂, NaF-ZrF₄, NaF-RbF, NaF-KF, and LiF-BeF₂ could serve as candidate carrier salts due to their low tritium yield and low cost \cite{24,25}. Uranium enrichment can range from 2 at% (atomic percentage) to 20 at% depending on fuel availability and burnup requirements. In sm-TMSR designs, thorium utilization is a major concern for thorium-uranium breeder MSRs. Additionally, different design schemes employ various component structures, such as hexagonal plate prisms, quadrangular block prisms, and hexagonal block prisms \cite{26}. These selection issues were analyzed from a neutronic perspective in our previous work \cite{27-30}, though few optimization analyses have been conducted for different structural parameters and fuel compositions. In 2017, Moser \cite{31} performed lattice optimization with different carrier salts and lattice sizes, but this optimization did not include burnup calculations.
This study conducted burnup optimization by varying the mole concentration of heavy nuclei fuel in the initial molten salt and the volume fraction of molten salt in the active core. To restrain the increase in heavy nuclei fuel during operation, feeding fuel under different uranium enrichments, including those exceeding 20 at%, was analyzed. Additionally, a detailed comparison between ²³²Th and ²³⁸U as startup breeder fuel was performed under various structural parameters to determine the optimal burnup region. Finally, reactor size was varied to evaluate its effect on burnup, considering size limitations for the reactor vessel arising from modular assembly, transportation, and replacement.
2 Calculation Model and Method
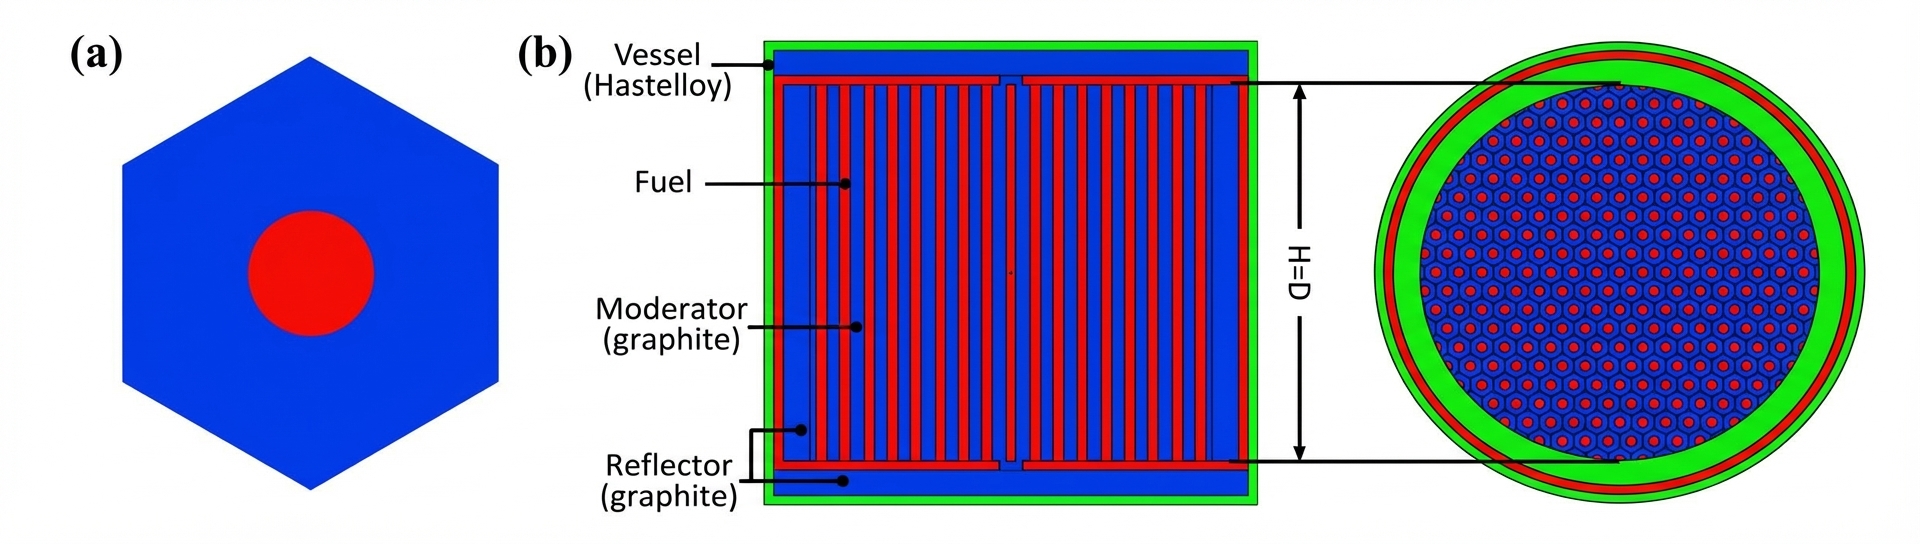
Sections 3.1–3.4 of this study employ a hexagonal lattice with total reflection boundary conditions as the calculation model, while Section 3.5 uses the complete reactor core as the calculation model. The lattice model is illustrated in Fig. 1(a). The lattice pitch was set to 20 cm to ensure a sufficiently negative temperature reactivity coefficient \cite{18,32} and to provide better spatial self-shielding effects on burnup \cite{31}. The outer layer consisted of a graphite moderator, the inner layer was a molten salt channel, and the carrier salt was FLiBe molten salt (a mixture of LiF and BeF₂). The main parameters of the lattice model are listed in Table 1.
The core model is shown in Fig. 1(b). Graphite reflectors were 30 cm thick to prevent neutron leakage, and the outer vessel of the reactor core was made of Hastelloy-N alloy with a 5 cm thickness. The core model had equal diameter and height, with core diameters calculated as 2, 3, 4, 5, 6, and 10 m, respectively.
In this study, the volume fraction of molten salt in the active core (VF), the mole concentration of heavy nuclei fuel in the initial molten salt (HN₀), the enrichment of feeding uranium (EFU), the core diameter, and the choice between LEU startup fuel or Th-U startup fuel were varied to obtain optimal burnup with the once-through cycle. VF and HN₀ are defined as:
$$
VF = \frac{V_{\text{salt}}}{V_{\text{salt}} + V_{\text{graphite}}}
$$
where $V_{\text{salt}}$ is the volume of molten salt and $V_{\text{graphite}}$ is the volume of graphite.
$$
HN_0 = \frac{n_U + n_{Th}}{n_U + n_{Th} + n_{Li} + n_{Be}}
$$
where $n_U$, $n_{Th}$, $n_{Li}$, and $n_{Be}$ are the initial moles of U, Th, Li, and Be, respectively.
HN refers to the accumulated concentration of heavy nuclei in the core, including both the initial amount and the added amount, and does not consider nuclide evolution. HNₘ refers to the concentration of heavy nuclei remaining after evolution. They can be expressed as:
$$
HN = \frac{\dot{n}U + \dot{n}}}{\dot{nU + \dot{n}} + \dot{n{Li} + \dot{n}}
$$
$$
HN_{\text{rem}} = \frac{n_U(t) + n_{Th}(t)}{n_U(t) + n_{Th}(t) + n_{Li}(t) + n_{Be}(t)}
$$
where $\dot{n}U$, $\dot{n}}$, $\dot{n{Li}$, and $\dot{n}(t)$ are the moles of U, Th, Li, and Be that vary with time, taking addition and consumption into account.}$ are the mole rates of U, Th, Li, and Be, $t$ is time, and $n_U(t)$, $n_{Th}(t)$, $n_{Li}(t)$, and $n_{Be
Burnup ($BU$) is defined as the energy produced per unit mass of fuel added to the core, including the initial loading fuel. $m_U$ is the total uranium mass, which also changes with operation time. $BU$ can be expressed as:
$$
BU = \frac{\int_0^t P \, dt}{m_U(t)}
$$
Reactor cores with different enrichments were studied, and natural uranium burnup ($BU_{\text{nat}}$) was used to compare burnup across different enrichments \cite{28}. Other reactor types also use uranium at different enrichment levels, and using $BU_{\text{nat}}$ facilitates comparison with these reactors (Section 3.5). $BU_{\text{nat}}$ is defined as the total output energy divided by the total amount of natural uranium fed, which includes enriched uranium fed into the reactor and depleted uranium outside the reactor. The natural uranium enrichment was 0.714 at%. $BU_{\text{nat}}$ can be expressed as:
$$
BU_{\text{nat}} = \frac{\int_0^t P \, dt}{m_{\text{nat}}}
$$
where $C_{\text{nat}}$ is the conversion factor of natural uranium and $x_{\text{tails}}$ is the uranium enrichment assuming 0.25 at% tails.
The capture-to-fission ratio is defined as the ratio of the capture cross-section to the fission cross-section, which can be expressed as:
$$
\alpha = \frac{\sigma_{\gamma}}{\sigma_f}
$$
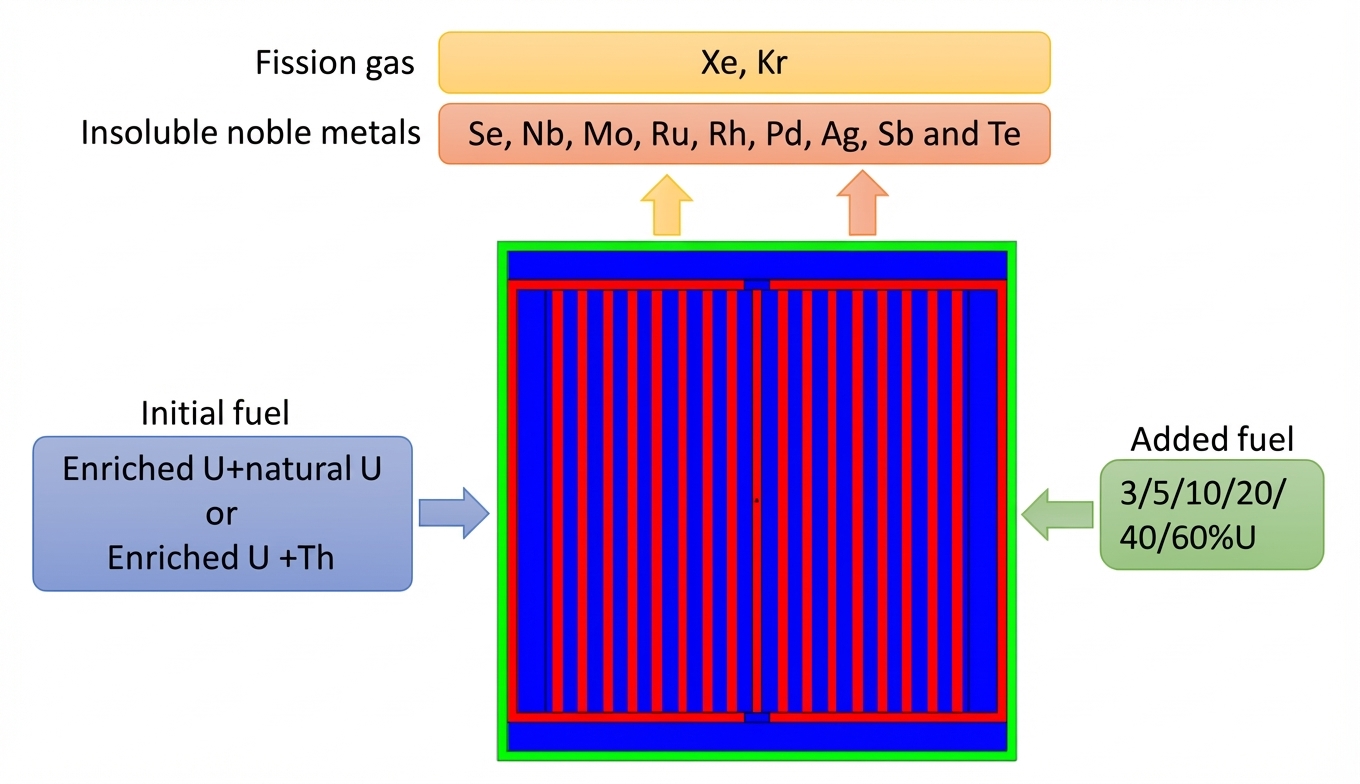
As shown in Fig. 2, the initial fuel consists of enriched uranium mixed with natural uranium or enriched uranium mixed with thorium. Fuel is mixed with the carrier salt at the beginning of life (BOL) to achieve criticality, followed by continuous fuel feeding to maintain reactivity near criticality. The continuous feeding process involves adding UF₄ fuel according to reactivity consumption. During reactor operation, it was assumed that all fission gases generated were removed. In this calculation, the fission gases are Xe and Kr. It is also assumed that all insoluble noble metals (Se, Nb, Mo, Tc, Ru, Rh, Pd, Ag, Sb, and Te) in molten salts can be removed by bubbling.
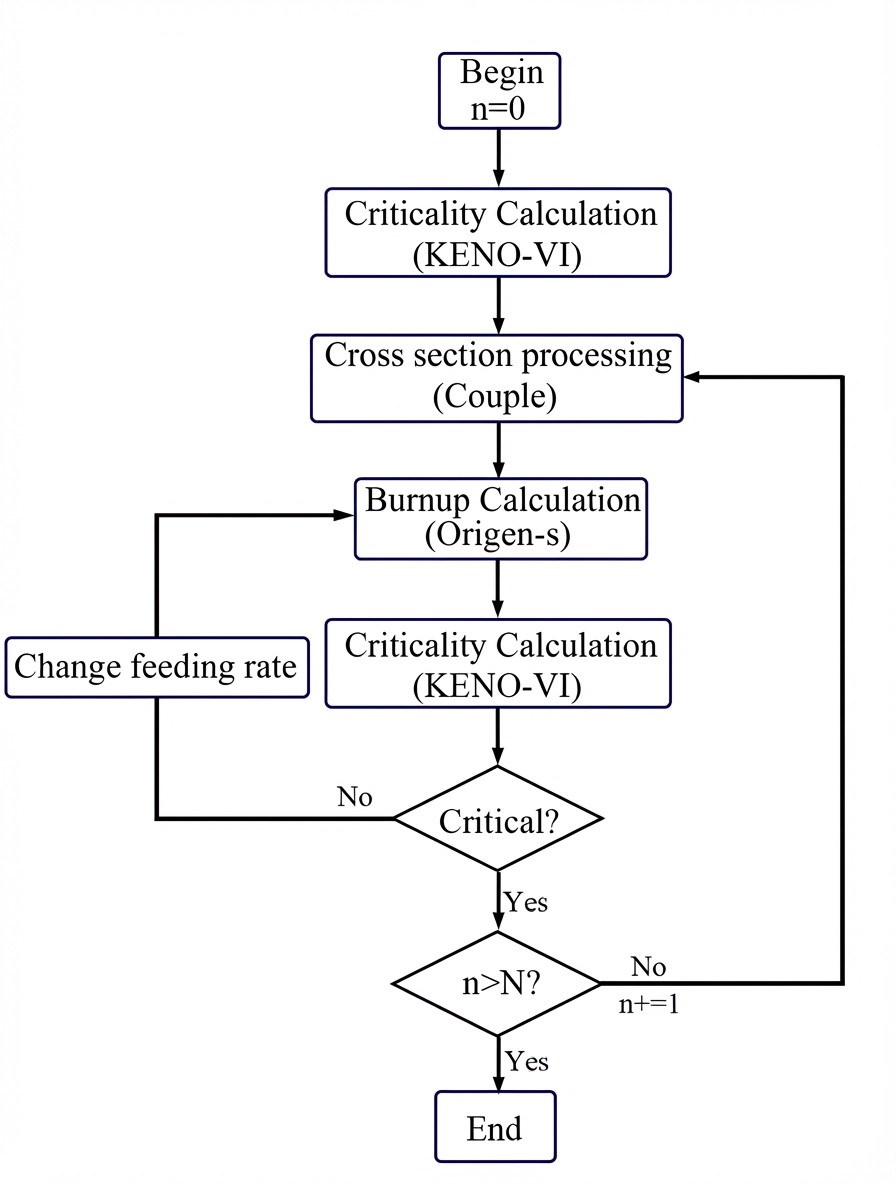
Fig. 3 shows the schematic coupling of MSR-RS. In this study, a tool called MSR-RS \cite{30} was used, which is an online processing program for MSRs based on the FORTRAN language. This program was developed by adding an external processing module to SCALE6.1 \cite{33}. MSR-RS uses the three-dimensional Monte Carlo criticality calculation module KENO-VI to perform criticality calculations. Coupled calculations generate a nuclear database for Origen-s by combining associated single-group cross-sections with ENDF/B-VII nuclear data and fission product yields. The single-group cross-sections were generated using a cross-section library of multiple groups and multigroup fluxes prepared in the 238-group ENDF/B-VII database. Origen-s was used for burnup calculations, including online feeding and post-processing. The multiplication factor was then obtained based on the KENO-VI module to determine whether the feeding amount met criticality requirements. If the multiplication factor was within the required range, the next calculation proceeded in the same manner until all burnup steps were completed.
3.1 Once-Through MSR Burnup Characteristics Varied with Operation Time
The fuel cycle of once-through MSRs differs from that of breeder MSRs or once-through PWRs. Online feeding leads to distinct burnup characteristics. Therefore, this section focuses on analyzing parameters that change with time, such as burnup, heavy nuclei concentration, and online feeding rate, as well as the general characteristics of once-through online feeding in MSRs.
To simplify optimization, a lattice model analysis was first carried out. We considered one condition (VF = 10%, HN₀ = 10 mol%, EFU = 20 at%) as an example to analyze the characteristics of a once-through fuel cycle using enriched uranium.
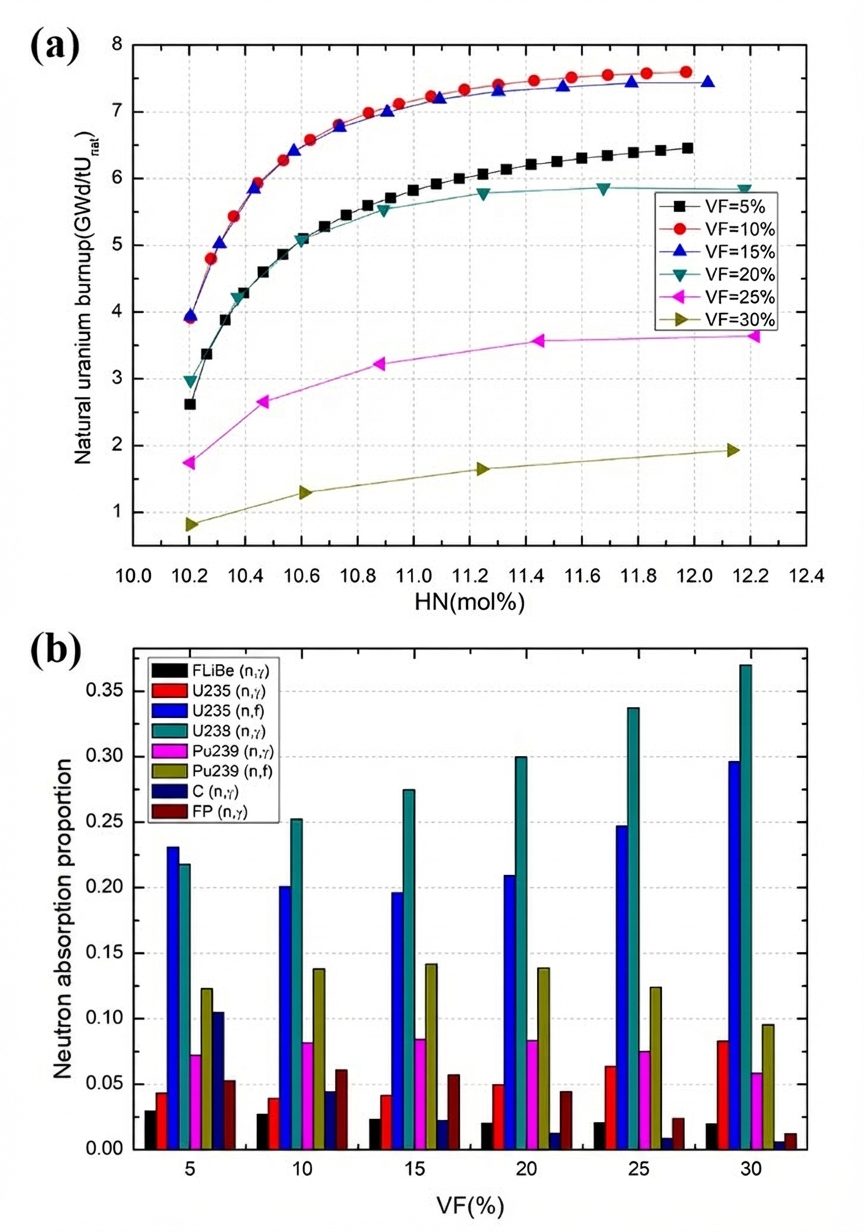
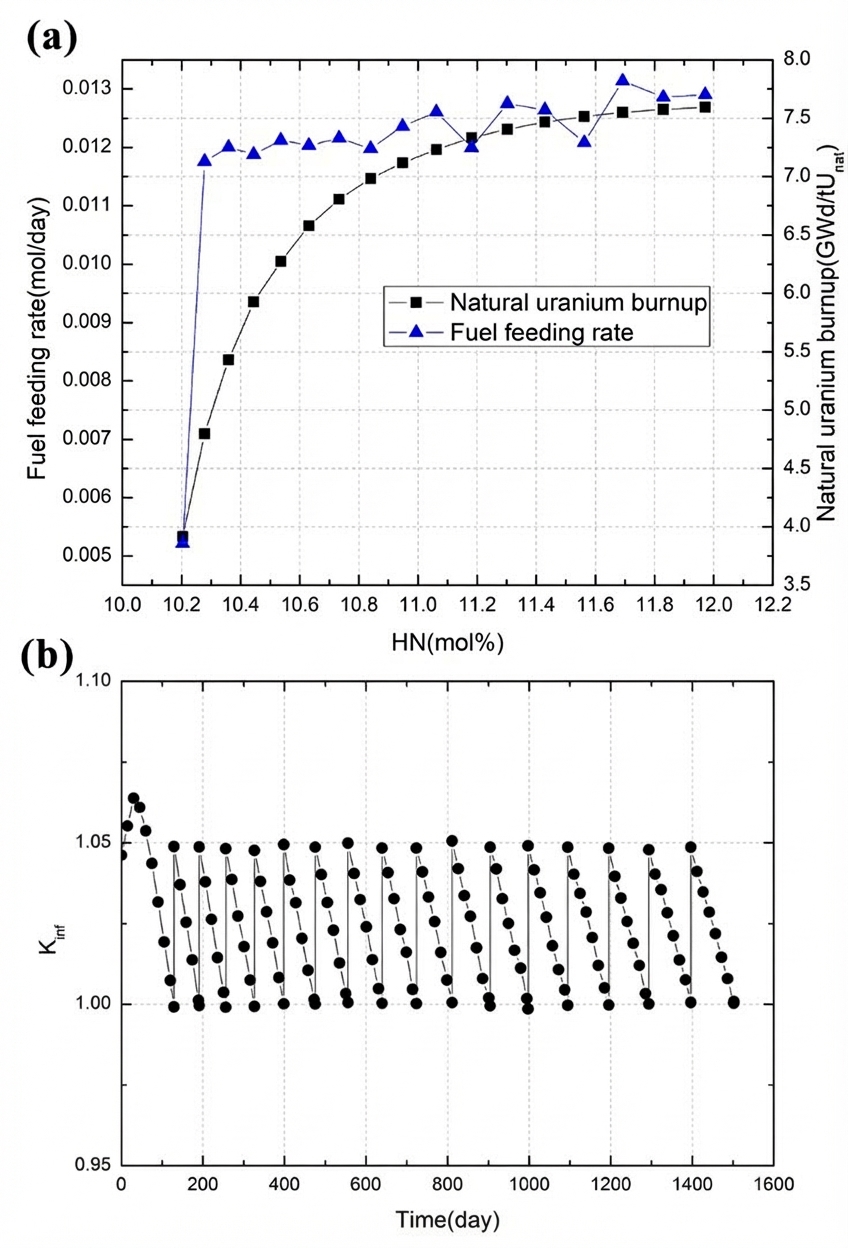
Fig. 4(a) shows the fuel feeding rate and natural uranium burnup varying with HN, while Fig. 4(b) shows $k_{\text{inf}}$ varying with reactor operating time. Fig. 5 illustrates HN varying with reactor operating time. To achieve criticality at BOL, the initial enrichment of ²³⁵U was adjusted under a fixed HN₀ condition. The initial $k_{\text{inf}}$ was approximately 1.05, with a standard deviation of approximately 0.0005. The continuous feeding process involved adding UF₄ fuel according to reactivity consumption. Because the reactor ran for a relatively long time when $k_{\text{inf}}$ automatically fed to 1.05 when it reached 1 (Fig. 4(b)), the time taken by each step was relatively stable, making the feeding rate relatively stable. Owing to the accumulation of heavy nuclei and the hardening of the energy spectrum, the feeding rate increased slightly, as shown in Fig. 4(a). With continuous feeding during reactor operation, HN continued to increase until it reached 12 mol%, which was the solubility limit of heavy nuclei in the carrier salt, as shown in Fig. 5. The end of operation is defined as the time required to reach 12 mol% HN.
The change in burnup was caused by the incomplete burning of the initial heavy nuclei. The feeding rate was relatively stable in the later stages, indicating that burnup was relatively stable. The proportion of initial fuel decreased with operation, so burnup approached the burnup of online feeding, which tended toward saturation. Burnup reaches its maximum value at the end of life (EOL), and this value is taken as the optimum burnup. When initial conditions are changed, the maximum burnup may appear before EOL, and this burnup is taken as the optimum burnup. HN is an important index for determining operation life because of the solubility limitation of heavy nuclei. Given its approximate linearity with time and its ability to separate from core power density, fuel volume, and other related parameters, HN can be used to replace the time coordinate in the following analysis.
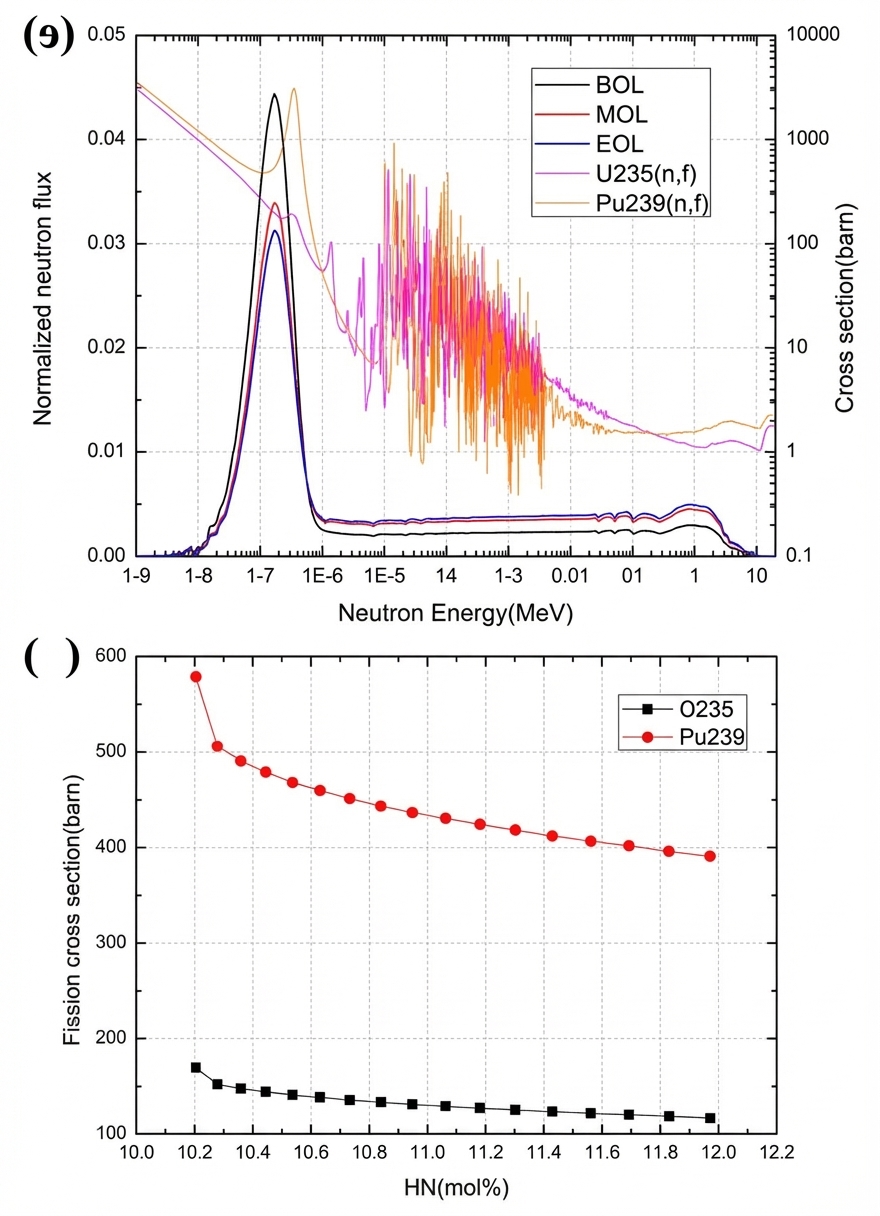
The largest contribution to burnup comes from the fission reaction rate. The most important fission nuclides were ²³⁵U and ²³⁹Pu. The single-group fission microscopic cross-section and nuclide inventory affected their fission rates. As shown in Fig. 6, the amount of ²³⁵U is approximately four times that of ²³⁹Pu. In the initial stage, the amount of ²³⁵U decreased due to fission and then increased with feeding. Meanwhile, ²³⁸U also increased due to feeding, and ²³⁹Pu generated by ²³⁸U conversion also increased, though the trend gradually slowed. The single-group fission microscopic cross-section was also affected by the neutron energy spectrum. As shown in Fig. 7(a), the neutron spectrum gradually hardened from BOL to EOL. As shown in Fig. 7(b), the single-group fission microscopic cross-section of ²³⁹Pu was several times that of ²³⁵U due to the first resonance peak difference of the fission cross-section near the Maxwell peak of the neutron energy spectrum (Fig. 7(a)). Both decreased with operation time, as the Maxwell peak declined at EOL.
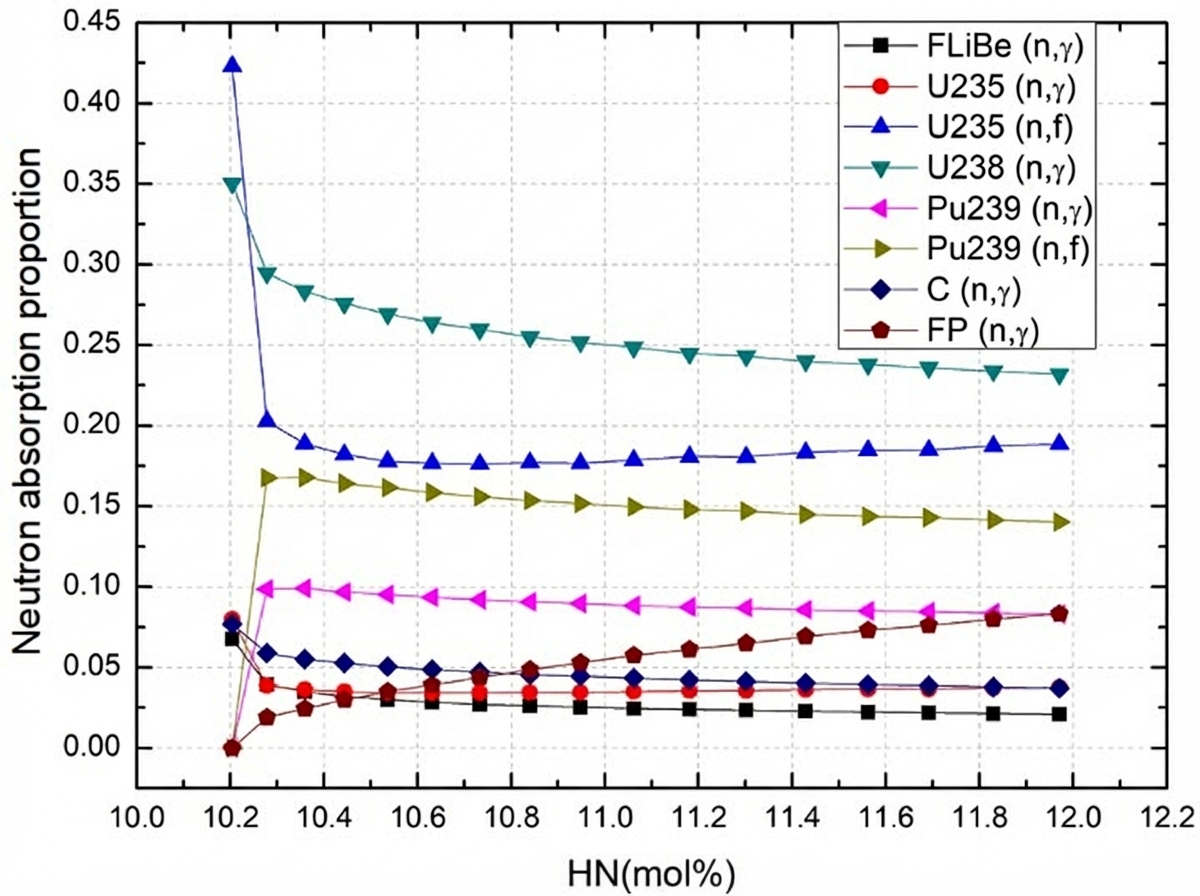
Finally, the fission reactions of ²³⁵U and ²³⁹Pu and the capture reactions of other major nuclides were studied, as shown in Fig. 8. The neutron absorption proportion refers to the fraction of different neutron absorption reactions for different nuclides. All neutron absorption proportions summed to 1. The amount of ²³⁵U was several times greater than that of ²³⁹Pu, as shown in Fig. 6. In contrast, the cross-section of ²³⁵U was much smaller than that of ²³⁹Pu, as shown in Fig. 7(b). Therefore, the fission reaction proportion of ²³⁵U was slightly higher than that of ²³⁹Pu. The fission of ²³⁵U decreased initially and slowly increased under the combined effect of inventory and single-group fission microscopic cross-section. However, the fission of ²³⁹Pu first rapidly increased and then slowly decreased. Owing to the large initial loading of ²³⁸U, the capture reaction proportion of ²³⁸U was highest, but it decreased with operation time due to its strong spatial self-shielding effect and weak competition with ²³⁵U and fission products. Furthermore, at VF = 10%, the fuel proportion in the reactor core is small, and neutron absorption by graphite and carrier salt is large at BOL, gradually decreasing with increasing heavy nuclei during operation. Fission products increased significantly with operation, which may exceed the total decrease in neutron absorption by graphite and carrier salt, causing burnup to grow more slowly and finally become stable.
3.2 Effects of VF and HN₀ on Burnup
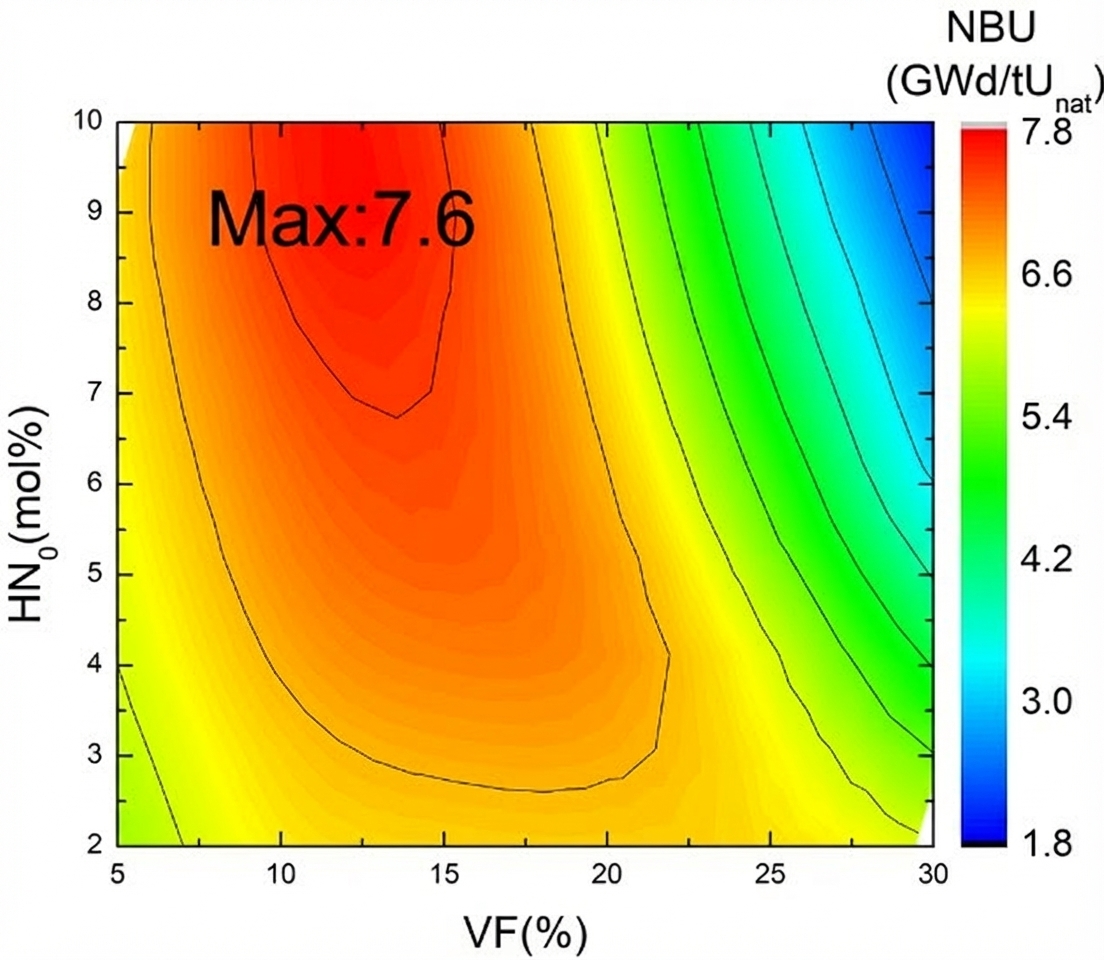
To study the influence of VF and HN₀ on burnup, different conditions were analyzed. HN₀ values were set as 2, 4, 6, 8, and 10 mol%. VF values were set as 5, 10, 15, 20, 25, and 30%. EFU was set as 20 at%. The natural uranium burnup is shown in Fig. 9. Results show that natural uranium burnup first increased then decreased with increasing VF, and increased with increasing HN₀. The maximum optimum natural uranium burnup occurred in the 10–15% VF and 7–10 mol% HN₀ range.
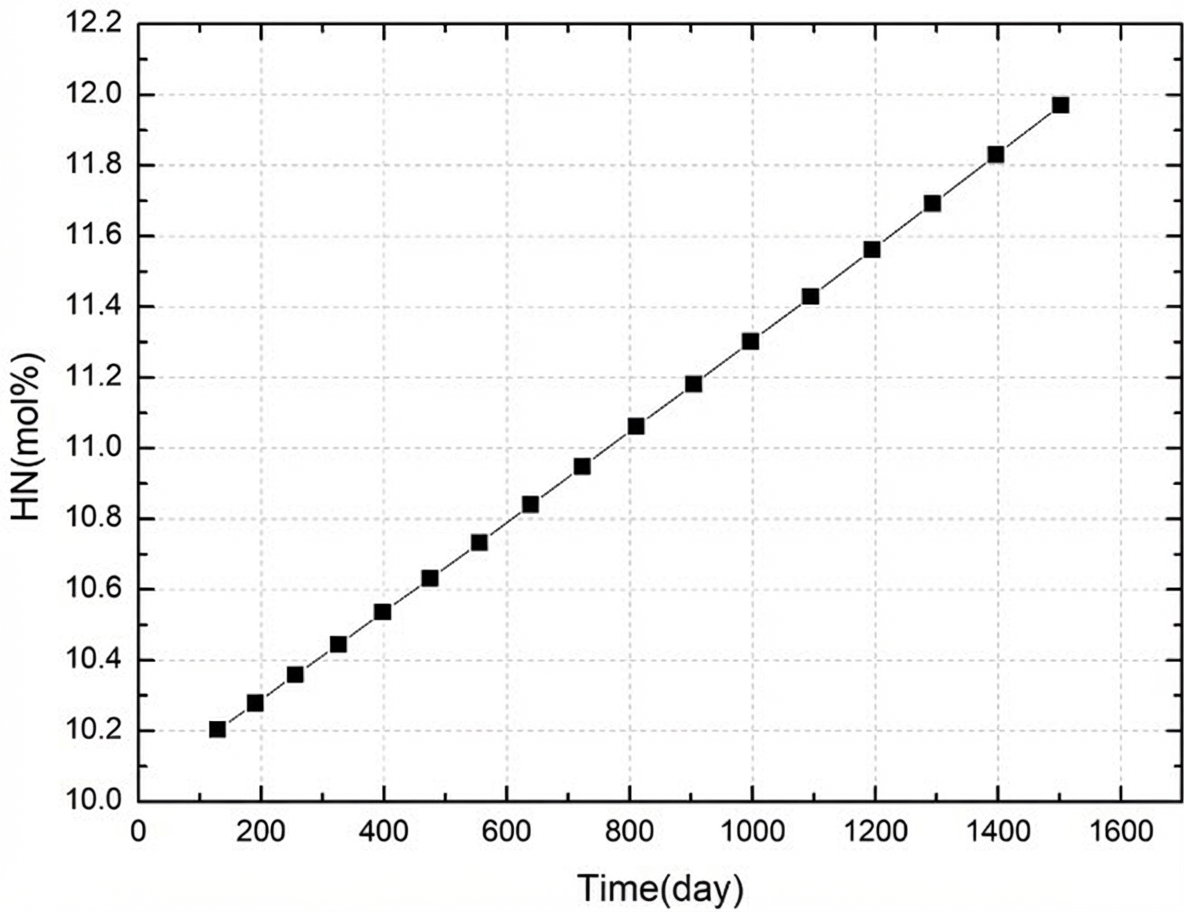
To analyze the impact of VF, we compared cases where EFU was 20 at%, HN₀ was 10 mol%, and VF values were 5, 10, 15, 20, 25, and 30%. With increasing VF, natural uranium burnup first increased and reached its maximum when VF was 10% (Fig. 10(a)). The maximum was very close to that when VF was 15%, and the previous burnup curves almost coincided. As VF increased further, natural uranium burnup decreased. Figure 10(b) shows the neutron absorption proportions of different nuclides averaged over operation time under different VF conditions. When VF was 5%, the reactor core was in an over-moderated state, and the graphite absorption reaction proportion was approximately 10%, which is not conducive to burnup. Larger VF values produce a harder spectrum. When VF exceeded 20%, the absorption of ²³⁸U caused by neutron spectrum hardening increased significantly, which disadvantaged absorption by fissionable elements, so burnup began to decrease. Therefore, burnup is optimal when VF varies from 10% to 15%.
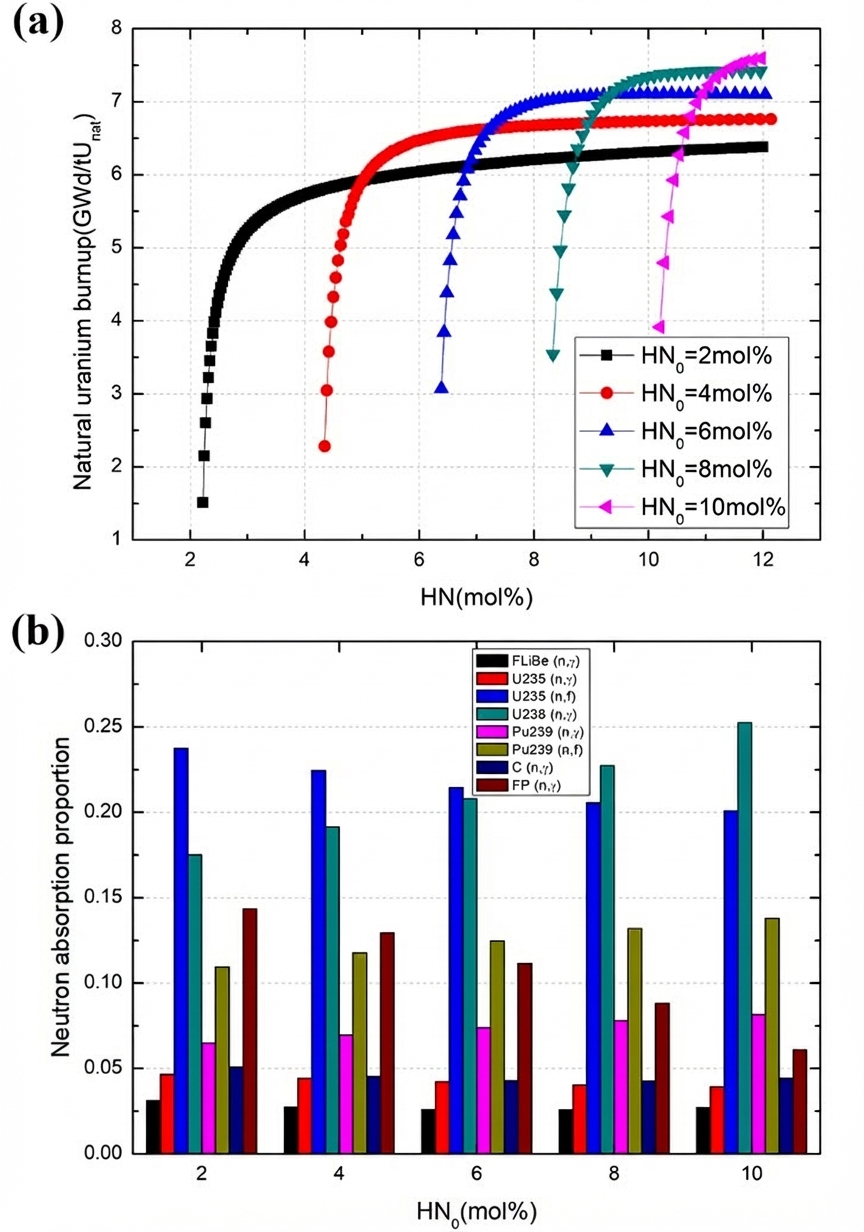
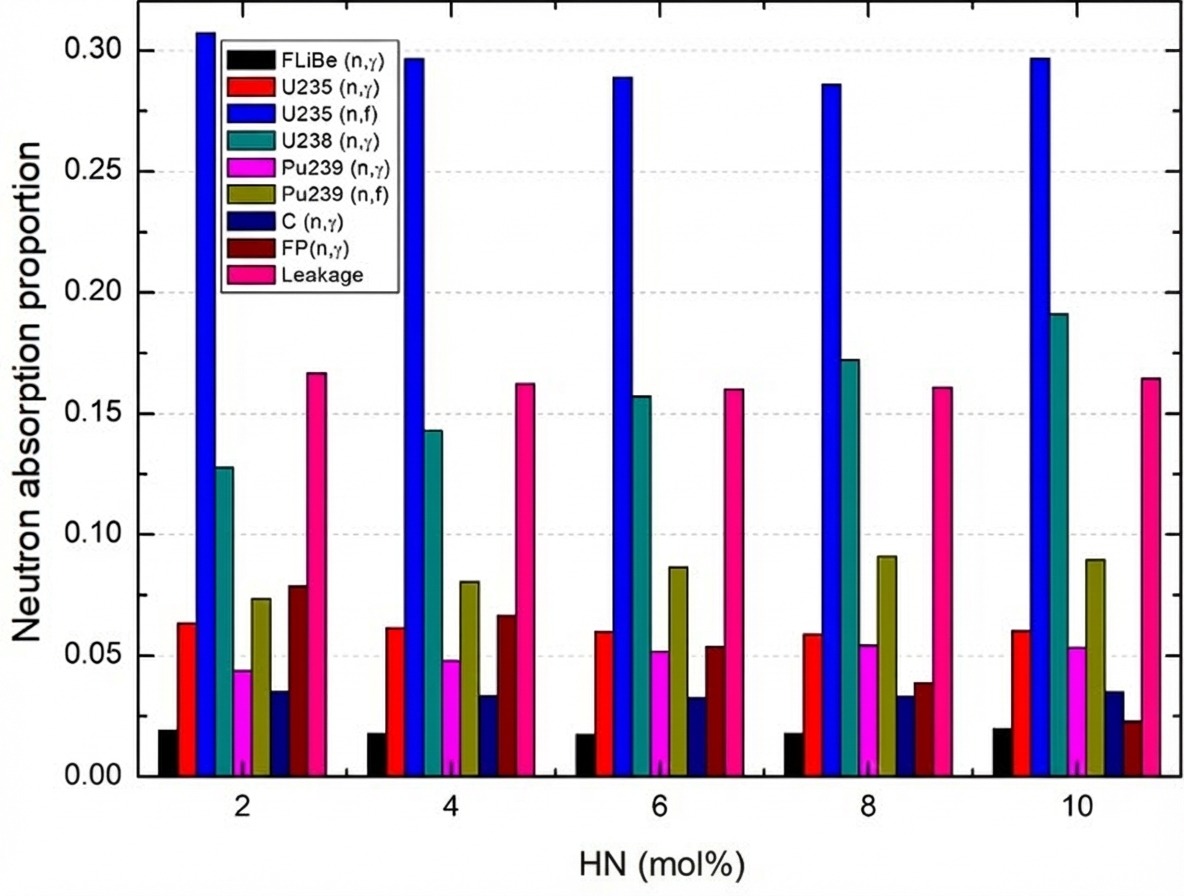
Next, the effects of different HN₀ values on burnup were studied. We compared cases where EFU was 20 at%, VF was 10%, and HN₀ values were 2, 4, 6, 8, and 10 mol%. When HN₀ increased, burnup increased. As shown in Fig. 11(a), the shapes of the burnup curves are very similar for different HN₀ values. Burnup rapidly increased during the first 2 mol% HN change (for 20 at% EFU), then tended toward saturation. Therefore, the saturation burnup was determined by the initial burnup, which had a positive relationship with HN₀. As a result, saturation burnup is larger for higher HN₀. As shown in Table 2, the initial enrichment was lower for higher HN₀ because of the larger fuel load. Therefore, the higher the proportion of ²³⁸U in the initial fuel for higher HN₀, the more ²³⁹Pu is converted. When HN₀ was small, not only was burnup low, but the lifetime was also long. The physical property changes and accumulation of fission products were large (Fig. 11(b)), creating great uncertainties and challenges in engineering implementation. If post-processing is not considered, a scheme with high HN₀ is preferred.
3.3 Effect of Uranium Enrichment on Burnup
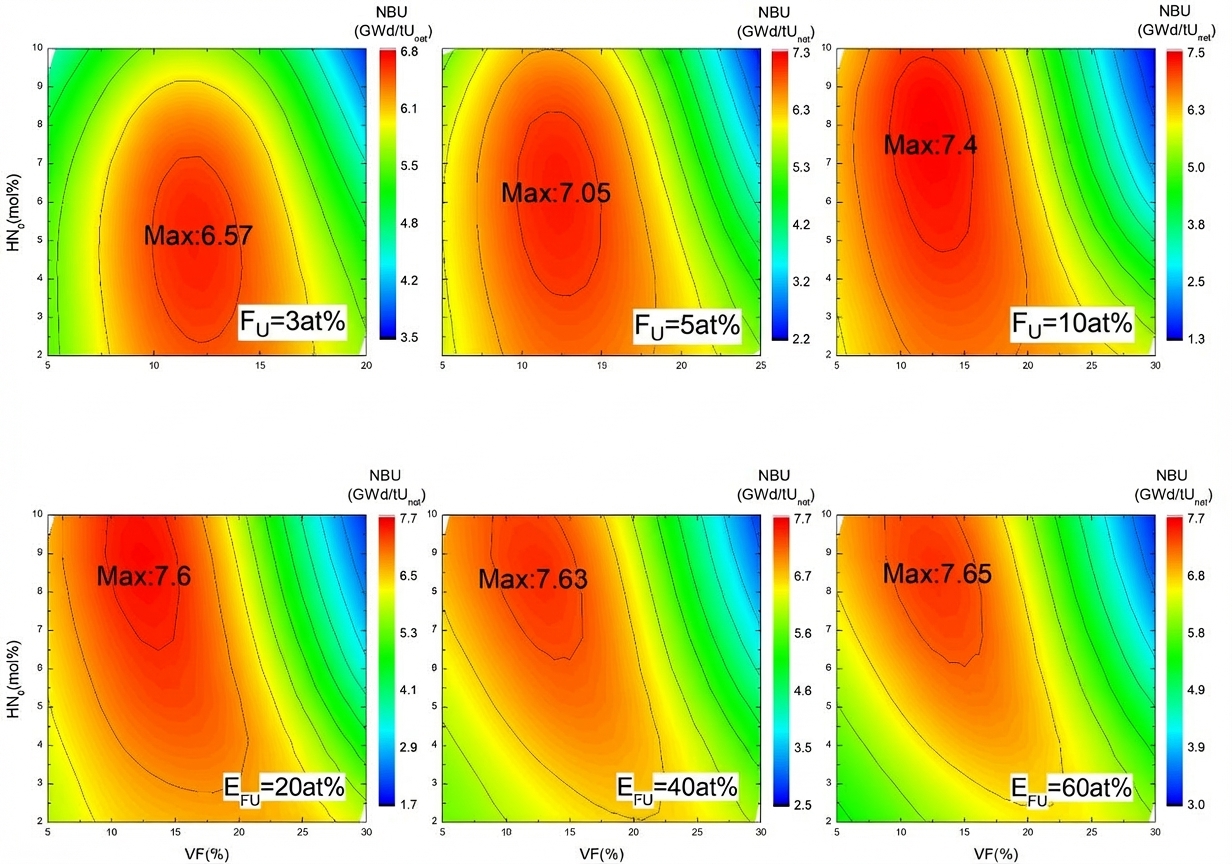
Conditions with EFU values of 3, 5, 10, 20, 40, and 60 at% for different VFs and HN₀ values were calculated. As shown in Fig. 12, when VF was large, feeding uranium with low enrichment could not meet the requirement of 5000 pcm excess reactivity. Therefore, when EFU was 3 at%, only VF values less than 20% could be calculated, and when EFU was 5 at%, only VF values less than 25% could be calculated. Results show that the maximum optimal natural uranium burnup occurred in the 10–15% VF range. With increasing uranium enrichment, the optimal HN₀ increased. When EFU was 3 at%, the optimal HN₀ was approximately 3–6 mol%. When EFU reached 20 at%, the optimal HN₀ remained around 7–10 mol%. The maximum value of the optimal natural uranium burnup tended to stabilize.
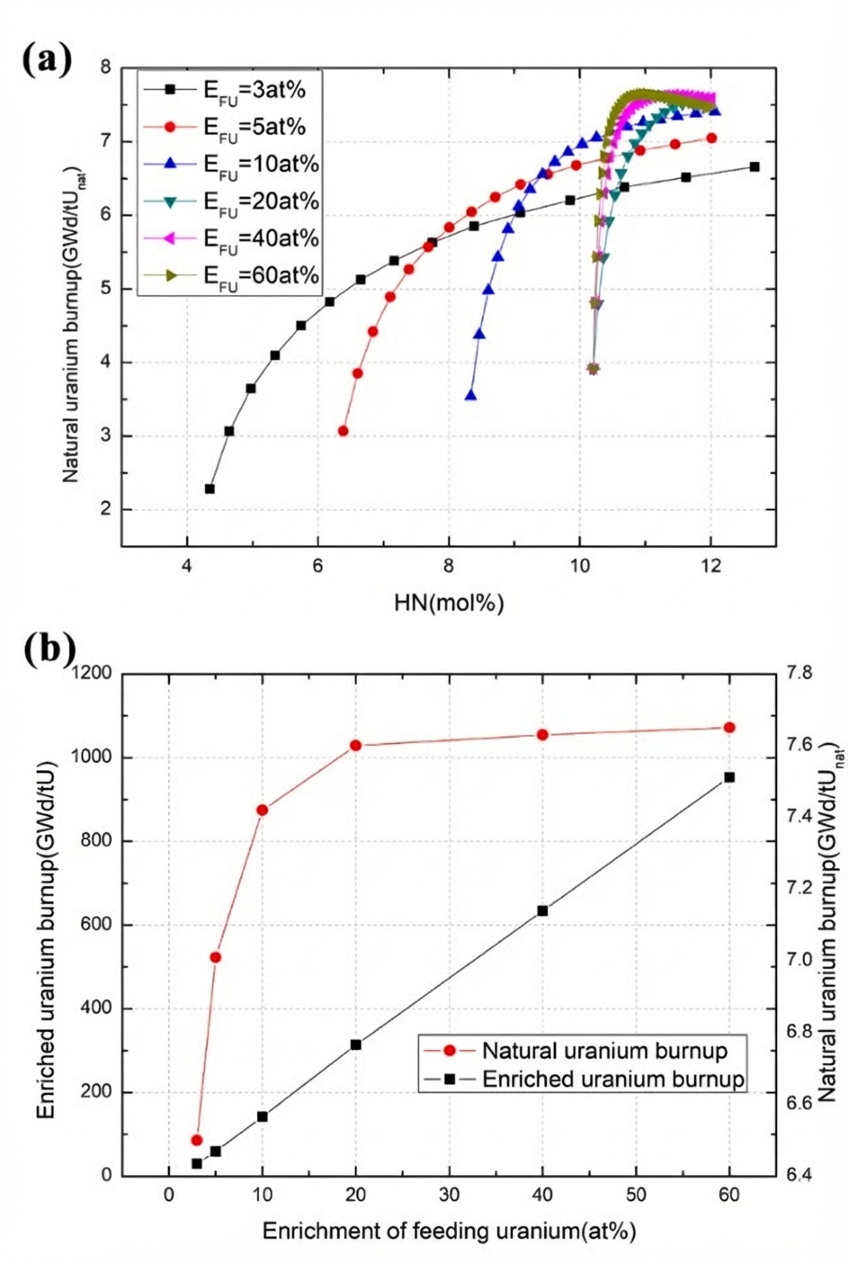
The conditions under which different EFU values reach maximum burnup were analyzed. Figure 13(a) shows that natural uranium burnup varies with HN. When EFU was less than or equal to 20 at%, burnup reached its maximum at EOL, whereas when EFU exceeded 20 at%, burnup reached its maximum and decreased before EOL. The decreasing trend of burnup indicates that without sufficient supplementation of breeding material ²³⁸U, the addition of ²³⁵U cannot offset the toxicity of fission products. As shown in Fig. 13(b), the relationship between maximum burnup and enrichment was basically linear. However, when converting to natural uranium burnup, due to the partial loss of ²³⁵U in the fuel enrichment process, the utilization rate of natural uranium was reduced at high enrichment levels, as shown in Eq. (7). After EFU reached 20 at%, natural uranium burnup was basically stable at approximately 7.6 GWd/tUₙₐₜ and did not increase significantly. Therefore, 20 at% EFU is sufficient.
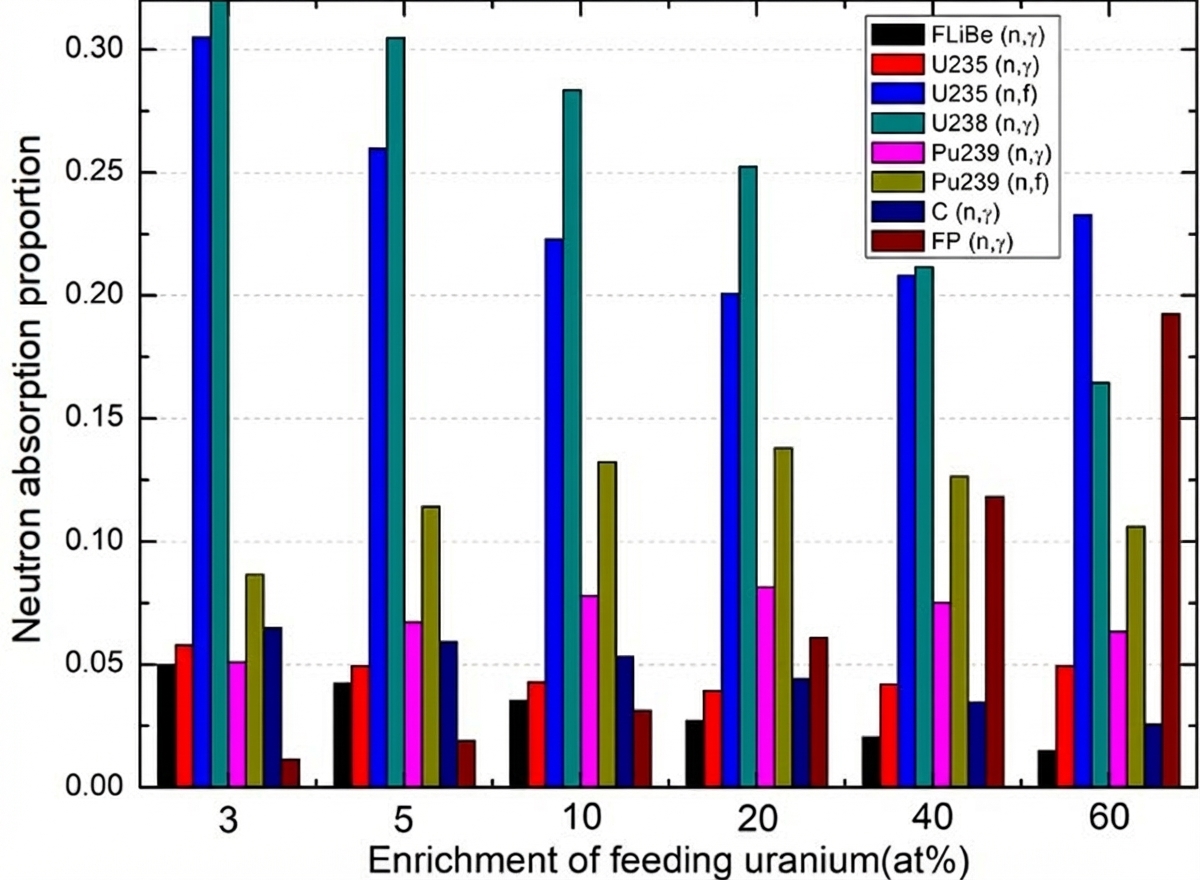
The major neutron absorption proportions for different EFU values with the same VF (10%) and HN₀ (10 mol%) are shown in Fig. 14. When EFU was low, neutron absorption by ²³⁸U was high, but plutonium fission was low. Because of the solubility limit, saturated burnup could not be reached (Fig. 13(a)). However, at high EFU, absorption by fission products increased rapidly, making burnup difficult to improve further. Therefore, the 20 at% EFU scheme is preferable.
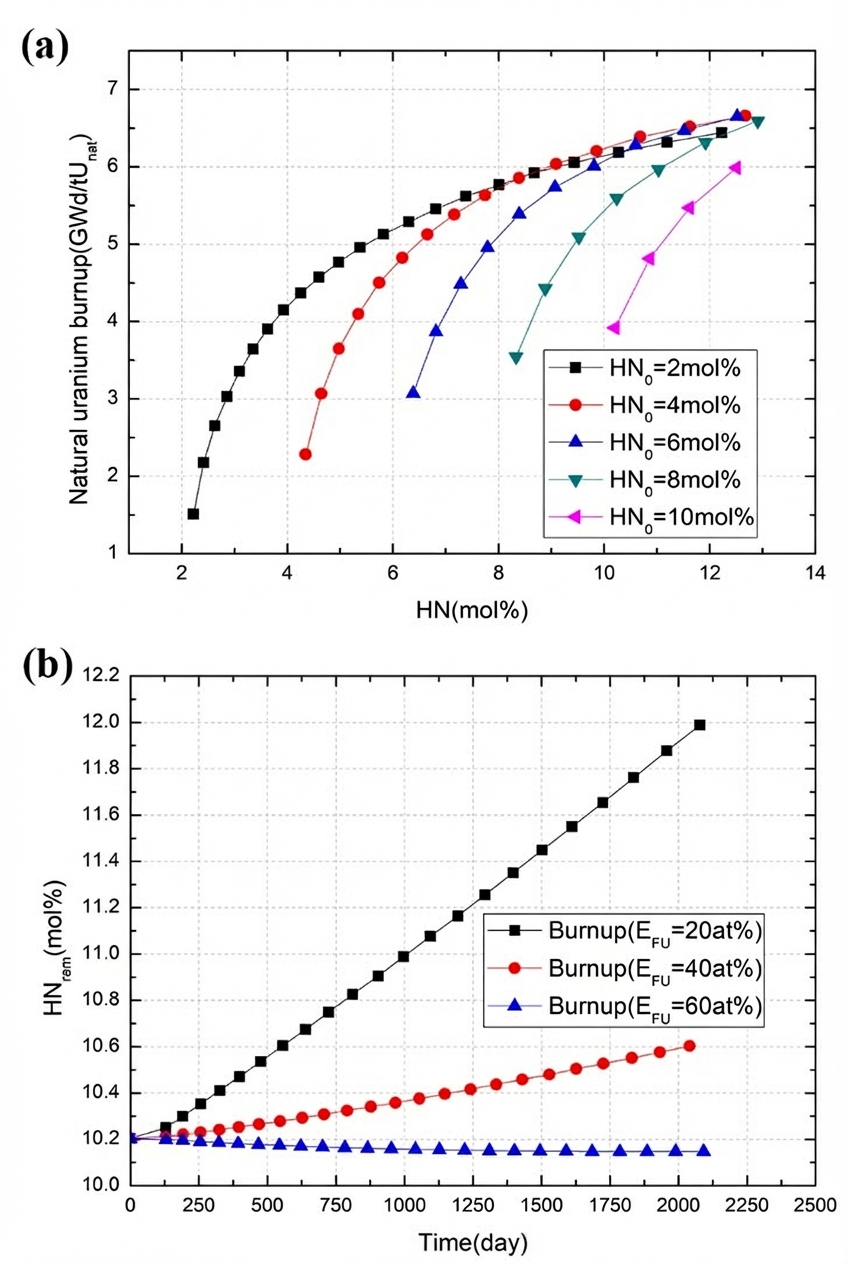
The region of maximum burnup shifts from low HN₀ to high HN₀ as EFU increases. As shown in Fig. 15(a), when EFU was 3 at%, the burnup curves all showed an upward trend. To achieve more saturated burnup, the initial HN₀ should be smaller, so maximum burnup is achieved at lower HN₀, such as 2 mol% and 4 mol%. However, when EFU was large (taking 20 at% as an example), the burnup curve saturated quickly with a small increase in HN, as shown in Fig. 11(a). When HN₀ was low, absorption by graphite and carrier salt was larger, so burnup was not high. A larger HN₀ is required to obtain higher burnup in the case of large EFU.
The conservation of heavy nuclei concentration in the molten salt reactor is an important factor in maintaining fuel salt stability. This concentration must change within a limited range to control the melting temperature of the fuel salt and to reduce operational deviation of the pump and heat exchanger in the fuel loop. Conservation of heavy nuclei concentration in the once-through cycle mode means that the mass of feeding uranium equals the fission consumption of heavy nuclides in the reactor. In this study, when EFU reached 60 at%, HNₘ was no longer increasing continuously and basically stabilized under conditions of 10 mol% HN₀ and 10% VF, as shown in Fig. 15(b). If less than 20 at% enriched uranium is advocated for nuclear nonproliferation, a higher operation temperature and thus more than 12 mol% HN₀ will be required to achieve conservation of heavy nuclei concentration.
3.4 Scheme Comparison of Startup by Uranium Fuel and Uranium-Thorium Mixed Fuel
Adding thorium to the initial fuel instead of natural uranium can increase burnup, as concluded in our previous work. In this section, we further identify the optimal burnup region for thorium mixed with 20 at% enriched uranium as the initial fuel. The ratio of thorium to 20 at% enriched uranium was adjusted to achieve criticality. The model and method were the same as those described in Section 3.2. Using Th-U as startup fuel provided significantly greater burnup, with a maximum value approximately 3.1 GWd/tUₙₐₜ higher than using LEU as startup fuel. The position of maximum burnup with Th-U startup fuel was similar to that of the LEU startup fuel, occurring in the 10–15% VF and 7–10 mol% HN₀ range.
We considered 10% VF and 10 mol% HN₀, which yields maximum burnup, for further analysis. The variation of $k_{\text{inf}}$ with time is shown in Fig. 17(a). Similar to the LEU model, for the Th-U startup fuel, $k_{\text{inf}}$ was automatically fed to 1.05 when it reached 1. Unlike the LEU startup fuel model, where the initial $k_{\text{inf}}$ rose slightly, the initial $k_{\text{inf}}$ of the Th-U model decreased directly to 1. Figure 17(b) shows that the conversion ratio (CR) of the Th-U startup fuel model is significantly higher than that of the LEU startup fuel model, meaning that the Th-U startup fuel has a stronger ability to regenerate neutrons and requires less fuel. The reasons for this are as follows: First, the capture-to-fission ratio of ²³³U is much smaller than that of ²³⁹Pu, as shown in Tables 3 and 4. Second, the effective fission neutron number of ²³³U in the range of 10⁻⁸–10⁻⁶ MeV is larger than that of ²³⁹Pu. Moreover, the resonance self-shielding of ²³⁸U is more serious than that of the uranium-thorium mixture. As shown in Tables 3 and 4, the single-group capture cross-sections of ²³²Th and ²³⁸U with the Th-U startup fuel are larger than that of ²³⁸U with the LEU startup fuel, which is more conducive to conversion of breeder nuclides.
In the Th-U startup fuel model, fission was primarily contributed by ²³⁵U and ²³³U. As shown in Fig. 18, the fission reaction rate of ²³³U was higher than that of ²³⁵U, indicating that reactor operation was dominated by ²³³U. The neutron absorption proportion of ²³³U increased significantly in the early lifetime and then gradually decreased due to thorium depletion. The neutron absorption of ²³⁵U declined in the early stage and tended to balance between self-consumption and continuous feeding. The neutron absorption of ²³²Th was larger than that of ²³⁸U due to the large initial amount of ²³²Th.
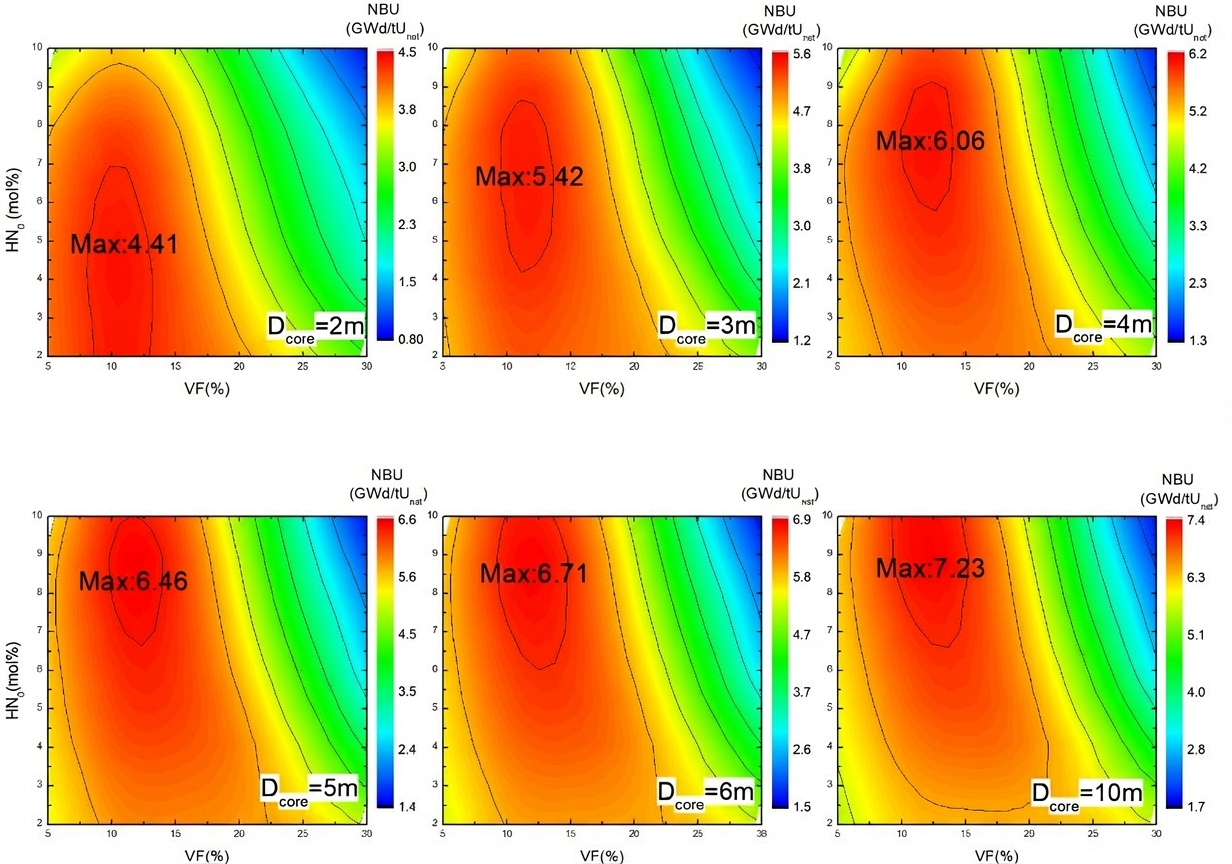
3.5 Effect of Core Volume on Burnup
Neutron leakage does not occur in the lattice model, so the impact of neutron leakage must be considered in the core model. The neutron leakage rate of the reactor is related to the shape and volume of the reactor core. The influence of different core volumes on burnup is examined below.
The burnup calculation results for different core volumes are shown in Fig. 19. VF values were 5, 10, 15, 20, 25, and 30%; HN₀ values were 2, 4, 6, 8, and 10 mol%; and EFU was 20 at%. Burnup increased with increasing core volume. Moreover, the positions where maximum burnup appeared were basically between 10–15% VF, shifting toward increasing HN₀ as volume increased.
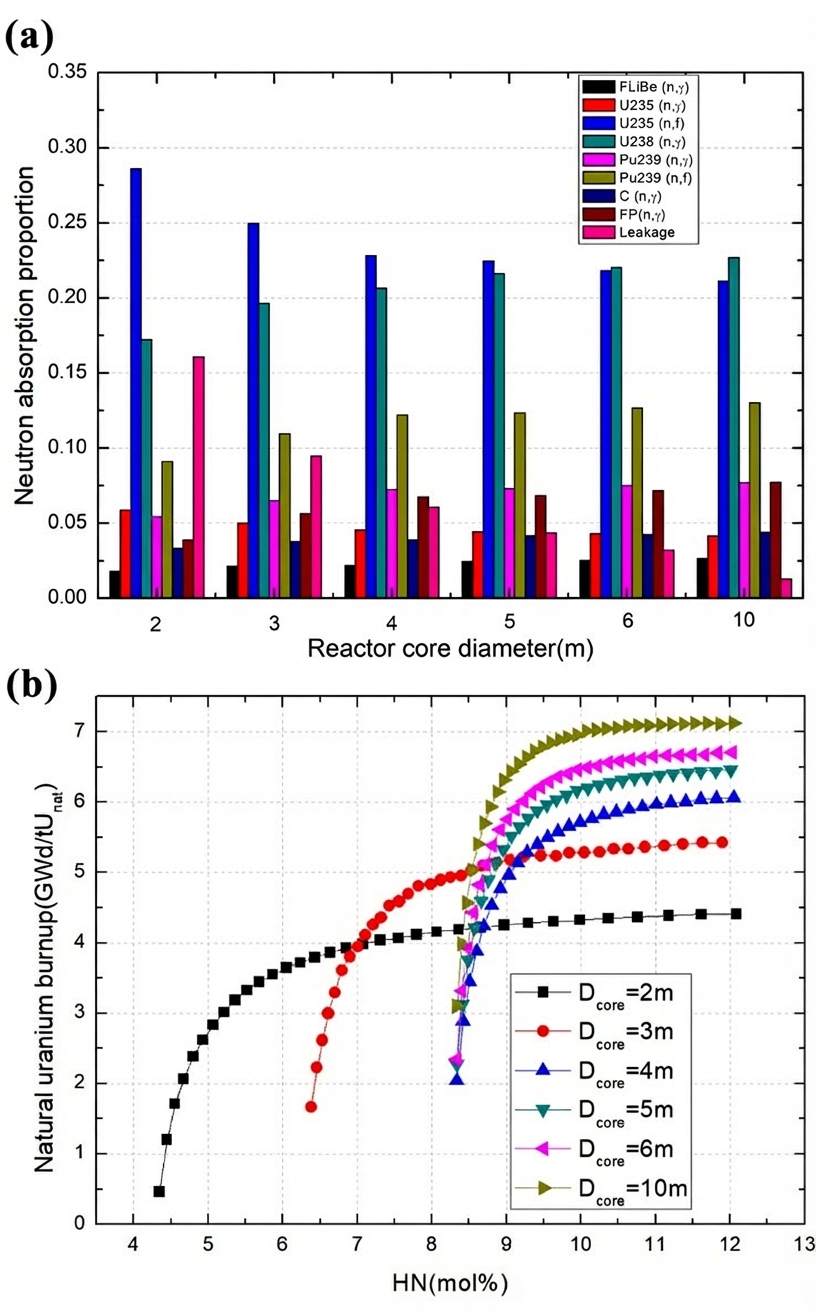
The neutron absorption proportions for 10% VF, 8 mol% HN₀, and different core volumes are shown in Fig. 20(a). Leakage includes alloy barrel neutron absorption and neutron loss from the reactor core. The proportion of leakage was negatively associated with volume. For a core diameter of 2 m, the leakage proportion exceeded 15%. Increased leakage requires increased fission of ²³⁵U, which further requires increased ²³⁵U inventory in the reactor core, preventing effective utilization of uranium fuel.
For different volumes, the burnup curves of the schemes with maximum burnup all reached saturation (Fig. 20(b)). For smaller volumes, the HN₀ of the scheme was also lower. When the core diameter reached 4 m, HN₀ stabilized at 8 mol%. Burnout at EOL is greater for larger volumes.
For a core diameter of 2 m, the initial fuel enrichment was greater when HN₀ was smaller, as shown in Table 5. Therefore, during operation, the average fuel enrichment is also higher, increasing burnup. As shown in Fig. 21, absorption by fission products also increased when HN₀ was smaller, which is not conducive to burnup. The combination of these two effects causes maximum burnup when HN₀ is 4 mol%. With increasing core volume, the difference in initial fuel enrichment decreased and the effect of fission products increased, so the optimal burnup point moves toward higher HN₀ with increasing volume.
In the Th-U startup fuel model, the position change of maximum burnup with increasing volume was similar to that of the LEU startup fuel model, but the value and gradient of burnup were larger than those of the LEU startup fuel model, as shown in Fig. 22.
Similar to the LEU startup fuel model, the neutron absorption proportions for 10% VF, 8 mol% HN₀, and different core volumes were analyzed. As shown in Fig. 23, the absorption of non-fission nuclides in the Th-U startup fuel model was similar to that of the LEU startup fuel model. In the Th-U startup fuel model, the fission proportion of ²³³U was significantly larger than that of ²³⁹Pu in the LEU startup fuel model when the core volume was large. For a core diameter of 10 m, the fission of ²³³U was almost the same as that of ²³⁵U, which was slightly smaller than the fission of ²³⁵U in the LEU startup fuel model. Therefore, larger core volumes are more favorable for thorium contribution to burnup.
Compared with conventional water reactors, molten salt reactors using Th-U startup fuel have a greater advantage in burnup, and reactor sizes differ. For a core diameter of 6 m, natural uranium burnup can reach 8.66 GWd/tUₙₐₜ, which is larger than heavy water reactors (approximately 7.5 GWd/tUₙₐₜ) \cite{34}. Currently, small modular reactors (SMRs) must meet requirements for modular assembly, transportation, and replacement, and the reactor core diameter is generally required to be less than 3.5 m considering transportation constraints, which impacts burnup. Taking a core diameter of 3 m as an example, for the Th-U startup fuel model, natural uranium burnup can reach 7.44 GWd/tUₙₐₜ, which is better than PWRs (less than 5 GWd/tUₙₐₜ) \cite{35}.
3.6 Temperature Reactivity Coefficient
Considering reactor inherent safety, the temperature reactivity coefficient (TRC) must be negative. The TRC can be decomposed into fuel TRC (FTRC) and graphite TRC (GTRC). The FTRC was divided into the TRC caused by the density effect (fuel density coefficient) and the TRC resulting from the Doppler effect (fuel Doppler coefficient) \cite{32}.
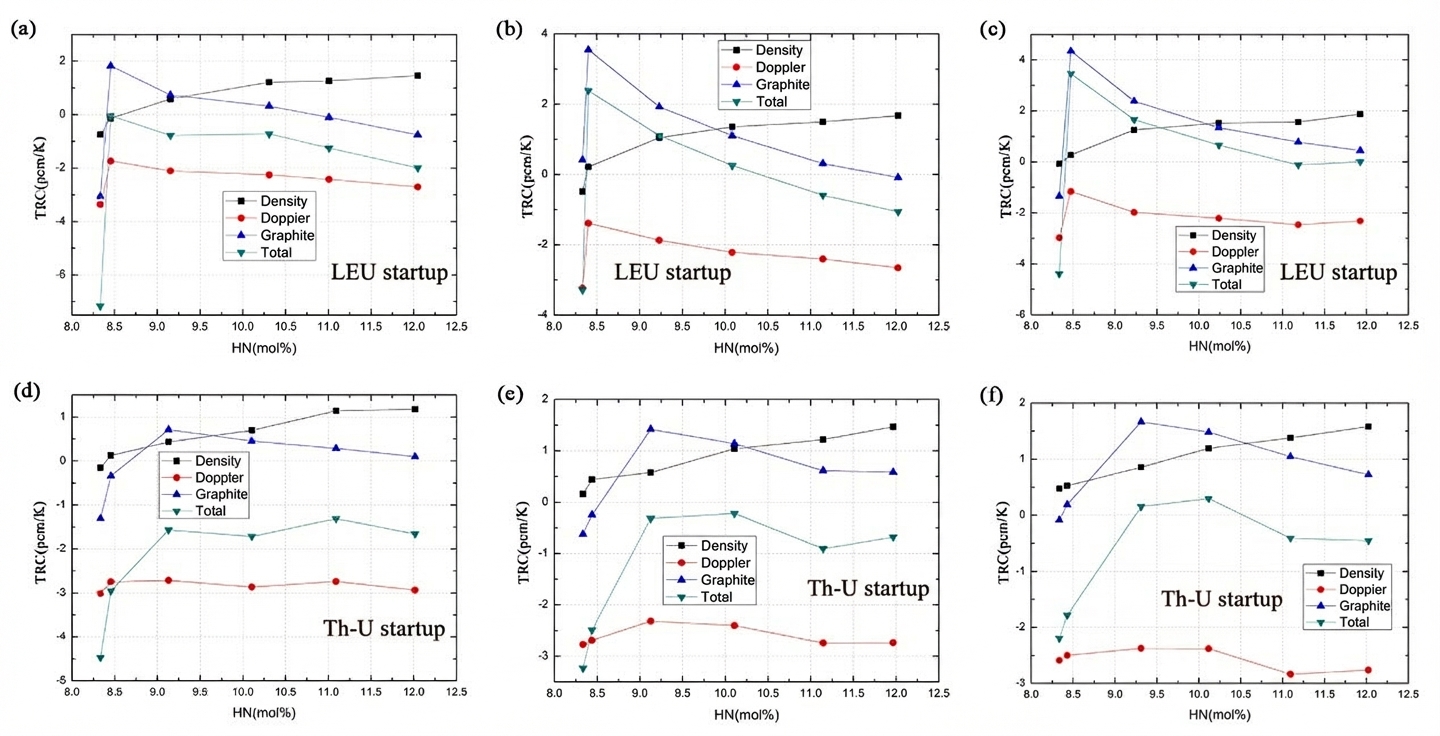
With both LEU startup fuel and Th-U startup fuel, the Doppler TRCs, GTRCs, and total TRCs for 10% VF and 8 mol% HN were calculated when natural uranium burnup was largest for different core volumes. The standard deviation of $k_{\text{eff}}$ was about 0.00005, resulting in a statistical error of 0.12 pcm/K for the total TRC. The results are presented in Fig. 24.
Different startup fuels lead to different trends in TRCs changing with time. The total TRC was primarily affected by GTRC. With LEU startup fuel, the GTRC increased quickly and then decreased. With Th-U startup fuel, the GTRC took more time to reach its maximum and then slowly declined. For the same volume, the Th-U startup fuel model had a more negative total TRC than the LEU startup fuel model. For the same startup fuel model, larger volumes produced more positive total TRC values.
When the core diameter exceeds 4 m with LEU startup fuel, the total TRC can become positive during operation. For Th-U startup fuel schemes, the total TRC can become positive when the core diameter exceeds 6 m. Therefore, it is recommended to use schemes with core diameters less than or equal to 6 m with Th-U startup fuel.
4 Conclusion
A once-through molten salt reactor using enriched uranium and thorium was examined in this study. Different molten salt volume fractions (VFs), initial heavy metal concentrations (HN₀s), feeding uranium enrichments (EFUs), core volumes, and thorium addition have varying effects on burnup. The conclusions are as follows:
When VF is between 10% and 15%, natural uranium burnup is maximized. When VF is very small, neutron absorption by graphite is large, which is not conducive to burnup. When VF is large, the energy spectrum hardens and the fission cross-section decreases, which is unfavorable for burnup. Therefore, burnup is maximized at 10–15% VF.
The maximum burnup region is usually concentrated in the 7–10 mol% HN₀ range. This region shifts toward smaller HN₀ as EFU and core volume decrease.
When EFU exceeds 20 at%, burnup reaches saturation. This is because when EFU is too small, neutron absorption by ²³⁸U is too high, which is not conducive to fission. When EFU is too large, the increase in fission products is not conducive to burnup.
The Th-U startup fuel provides a higher conversion ratio and burnup than the LEU startup fuel. Maximum natural uranium burnup increases by 3.1 GWd/tUₙₐₜ for the single lattice model. This is because the conversion of ²³²Th replaces ²³⁸U, and the neutrons absorbed by ²³³U fission are higher than those by ²³⁹Pu. Therefore, the Th-U startup fuel model has stronger neutron regeneration capacity and requires less fuel, which is superior to the LEU startup fuel model in terms of burnup.
Reactor core volume has a positive relationship with burnup because of the negative relationship between neutron leakage and core volume.
The reactor core with the maximum natural uranium burnup calculated in this study was 10% VF, 8 mol% HN₀, 20 at% EFU, 10 m core diameter, with Th-U startup fuel. Combined with TRC analysis, and based on ensuring a negative total TRC while considering calculation point selection and different volume requirements for actual reactor cores, we recommend core schemes with 10–15% VF, 7–9 mol% HN₀, 20 at% EFU, core diameters less than or equal to 6 m, and Th-U startup fuel.
This study provides a reference for the core design of once-through molten salt reactors. Compared with other optimization studies on molten salt reactor burnup, the parameters studied here are more comprehensive. Building on this work, we will conduct further calculations of key safety parameters, such as the temperature reactivity coefficient and effective delayed neutron fraction, to select a scheme that meets safety requirements while achieving maximum economic efficiency.
Author Contributions
All authors contributed to the study conception and design. Material preparation, data collection, and analysis were performed by Meng-Lu Tan, Gui-Feng Zhu, and Zheng-De Zhang. The first draft of the manuscript was written by Meng-Lu Tan, and all authors commented on previous versions of the manuscript. All authors read and approved the final manuscript.
Funding
This work was supported by the Shanghai Sailing Program (No. 19YF1457900), Chinese TMSR Strategic Pioneer Science and Technology Project (No. XDA02010000), National Natural Science Foundation of China (No. 12005290), and Youth Innovation Promotion Association of the Chinese Academy of Sciences (No. 2020261).
References
- J. Krepel, B. Hombourger, V. Bykov et al., Molten salt reactor with simplified fuel recycling and delayed carrier salt cleaning, Paper presented at the 22nd International Conference on Nuclear Engineering ICONE'22 (Prague, July 2014)
- J. H. Wu, C.G. Yu, C.Y. Zou et al., Core design optimization for a novel heavy water moderated molten salt reactor. Nucl. Tech. 44(8), 080601 (2021). https://doi.org/10.11889/j.0253-3219.2021.hjs.44.080601 (in Chinese)
- C.Y. Zou, J.H. Wu, C.G. Yu et al., Influence of reprocessing efficiency on fuel cycle performances for molten salt reactor. Nucl. Tech. 44(10), 100602 (2021). https://doi.org/10.11889/j.0253-3219.2021.hjs.44.100602 (in Chinese)
- J. Serp, M. Allibert, O. Benes et al., The molten salt reactor (MSR) in generation IV: Overview and perspectives. Prog. Nucl. Energy 77, 308-319 (2014). https://doi.org/10.1016/j.pnucene.2014.02.014
- M.S. Kazimi, E.J. Moniz, C. Forsberg, The future of the nuclear fuel cycle, 1st edn. (The United States, Massachusetts Institute of Technology, 2011), pp.20-22
- C.W. Lau, C. Demaziere, H. Nylen et al., Improvement of LWR thermal margins by introducing thorium. Prog. Nucl. Energy 61, 48-56 (2012). https://doi.org/10.1016/j.pnucene.2012.07.004
- D. Heuer, E. Merle-Lucotte, M. Allibert et al., Towards the thorium fuel cycle with molten salt fast reactors. Ann. Nucl. Energy 64, 421-429 (2014). https://doi.org/10.1016/j.anucene.2013.08.002
- G. Ridley, O. Chvala, A method for predicting fuel maintenance in once-through MSRs. Ann. Nucl. Energy 110, 265-281 (2017). https://doi.org/10.1016/j.anucene.2017.06.043
- R. Rachamin, E. Fridman, A. Galperin, Feasibility assessment of the once-through thorium fuel cycle for the PTVM LWR concept. Ann. Nucl. Energy 85, 1119-1130 (2015). https://doi.org/10.1016/j.anucene.2015.07.030
- J.R. Engel, H.F. Bauman, J.F. Dearing et al., Conceptual design characteristics of a denatured molten-salt reactor with once-through fueling. Oak Ridge National Lab. ORNL/TM-7207 (1980). https://doi.org/10.2172/5352526
- N.K. Trinh, G.T. Parks, D. Kotlyar et al., Fuel cycle analysis of multi-batch operation of a denatured molten salt reactor, Paper presented at PHYSOR 2016 – Unifying Theory and Experiments in the 21st Century (Idaho, 1-5 May 2016)
- ThorCon. Design, https://thorconpower.com/design/; 2021 [Accessed 18 May 2021].
- L. Samalova, O. Chvala, G.I. Maldonado, Comparative economic analysis of the Integral Molten Salt Reactor and an advanced PWR using the G4-ECONS methodology. Ann. Nucl. Energy 99, 258-265 (2017). https://doi.org/10.1016/j.anucene.2016.09.001
- C.Y. Zou, X.Z. Cai, D.Z. Jiang et al., Optimization of temperature coefficient and breeding ratio for a graphite-moderated molten salt reactor. Nucl. Eng. Des. 281, 114-120 (2015). https://doi.org/10.1016/j.nucengdes.2014.11.022
- Z.M. Dai, in Molten Salt Reactors and Thorium Energy, ed by T.J. Dolan (Woodhead Publishing, 2017), pp. 531-540. https://doi.org/10.1016/B978-0-08-101126-3.00017-8
- J.E. Kelly, Generation IV International Forum: A decade of progress through international cooperation. Prog. Nucl. Energy 77, 240-246 (2014). https://doi.org/10.1016/j.pnucene.2014.02.010
- C.L. Brun, L. Mathieu, D.Heuer et al., Impact of the MSBR concept technology on long-lived radio-toxicity and proliferation resistance, Paper presented at Technical Meeting on Fissile Material Management Strategies for Sustainable Nuclear Energy (Vienna, September 2005)
- K. Nagy, Dynamics and fuel cycle analysis of a graphite-moderated molten salt nuclear reactor (Delft University of Technology, 2012) https://doi.org/10.4233/uuid:b4d5089d-c2de-446b-94cf-c563dd73e8f1
- S. Robertson, L. Dewan, M. Massie et al., Assessment of the neutronic and fuel cycle performance of the transatomic power molten salt reactor design. Oak Ridge National Lab. ORNL/TM-2017/475 (2017). https://doi.org/10.2172/1410921
- R.B. Briggs, Summary of the objectives, the design, and a program of development of molten-salt breeder reactors. Oak Ridge National Lab. ORNL-TM-1851 (1967). https://doi.org/10.2172/4361547
- L. Mathieu, D. Heuer, E. Merle et al., Possible configurations for the thorium molten salt reactor and advantages of the fast nonmoderated version. Nucl. Sci. Eng 161, 78-89 (2009). https://doi.org/10.13182/NSE07-49
- C.G. Yu, J.H. Wu, C.Y. Zou et al., Thorium utilization in a small modular molten salt reactor with progressive fuel cycle modes. Int. J. Energy Res. 43(8), 3628-3639 (2019). https://doi.org/10.1002/er.4511
- E. Merle, D. Heuer, M. Allibert et al., Optimization and simplification of the concept of non-moderated thorium molten salt reactor, Paper presented at International Conference on the Physics of Reactors "Nuclear Power: A Sustainable Resource" (Casino-Kursaal Conference Center, Interlaken, 14-19 September 2008)
- L. Mathieu, D. Heuer, R. Brissot et al., The thorium molten salt reactor: Moving on from the MSBR. Progress in Nuclear Energy, 2006. 48(7): 664-679. https://doi.org/10.1016/j.pnucene.2006.07.005
- X.X. Li, X.Z. Cai, D.Z. Jiang et al., Analysis of thorium and uranium based nuclear fuel options in Fluoride salt-cooled High-temperature Reactor. Prog. Nucl. Energy 78, 285-290 (2015). https://doi.org/10.1016/j.pnucene.2014.10.004
- O. Chvála, MSR lattice optimization for economic salts with LEU fuel, Paper presented at Proceedings of ICAPP 2014 (Charlotte, 6-9 April 2014)
- Y.W. Ma, X.X. Li, X.Z. Cai et al., Startup and burnup strategy for Th-U/U-Pu fuel cycles in an EM2 reactor. Prog. Nucl. Energy 85, 764-770 (2015). https://doi.org/10.1016/j.pnucene.2015.09.010
- G.F. Zhu, Y. Zou, R. Yan et al., Low enriched uranium and thorium fuel utilization under once-through and offline reprocessing scenarios in small modular molten salt reactor. Int. J. Energy Res. 43(11), 5775-5787 (2019). https://doi.org/10.1002/er.4676
- D.Y. Cui, X.X. Li, S.P. Xia et al., Possible scenarios for the transition to thorium fuel cycle in molten salt reactor by using enriched uranium. Prog. Nucl. Energy 104, 75-84 (2018). https://doi.org/10.1016/j.pnucene.2017.09.003
- D.Y. Cui, S. P. Xia, X.X. Li et al., Transition toward thorium fuel cycle in a molten salt reactor by using plutonium. Nucl. Sci. Tech. 28, 152 (2017). https://doi.org/10.1007/s41365-017-0303-y
- D. Moser, A. Wheeler, O. Chvala, Lattice optimization for graphite moderated molten salt reactors using low-enriched uranium fuel. Ann. Nucl. Energy 110, 1-10 (2017). https://doi.org/10.1016/j.anucene.2017.06.015
- M.L. Tan, G.F. Zhu, Y. Zou et al., Research on the effect of the heavy nuclei amount on the temperature reactivity coefficient in a small modular molten salt reactor. Nucl. Sci. Tech. 30(9), 140 (2019). https://doi.org/10.1007/s41365-019-0666-3
- Scale: A Comprehensive modeling and simulation suite for nuclear safety analysis and design. Oak Ridge National Lab. ORNL/TM-2005/39 (2011).
- Z.G. Liu, Study on core fuel management of slightly enriched uranium fuel for CANDU6 reactor (Shanghai Jiao Tong University, 2007)
- C.G.Yu, Research on physics performance of very high burn-ups PWR core (Harbin Engineering University, 2012)
Translated Figures