Abstract
An accelerator-based Boron Neutron Capture Therapy (AB-BNCT) experimental facility called D-BNCT01 has been recently completed and is currently able to generate a high-intensity neutron beam for BNCT related research. In this study, we perform several experiments involving water phantoms to validate the Monte Carlo simulation results and analyze the neutron beam characteristics. According to our measurements, D-BNCT01 may generate a neutron flux about 1.2×10⁸ n/cm2/s at the beam port using a 5 kW proton beam. Our results, also show that the thermal neutron flux depth distribution inside the water phantom is in good agreement with simulations. We conclude that D-BNCT01 may be effectively employed for BNCT research.
Full Text
Preamble
Evaluation of neutron beam characteristics for D-BNCT01 facility
Jun-Yang Chen¹,²,³,⁴, Jian-Fei Tong¹,³,⁴, Zhi-Liang Hu¹,³,⁴, Xue-Fen Han¹,²,³, Bin Tang¹,³, Qian Yu¹,²,³, Rui-Qiang Zhang¹,³, Chong-Guang Zhao¹,³, Jun Xu¹,³, Shi-Nian Fu¹,²,³, Bin Zhou¹,³,⁴,, Tian-Jiao Liang¹,²,³,⁴,
¹Institute of High Energy Physics, Chinese Academy of Sciences (CAS), Beijing, 100049, China
²University of Chinese Academy of Sciences (UCAS), Beijing, 100049, China
³Spallation Neutron Source Science Center, Dongguan, 523803, China
⁴Guangdong-Hong Kong-Macao Joint Laboratory for Neutron Scattering Science and Technology, Dongguan 523803, China
*Corresponding authors: binzhou@ihep.ac.cn (Bin Zhou); tjliang@ihep.ac.cn (Tian-Jiao Liang)
Abstract
An accelerator-based Boron Neutron Capture Therapy (AB-BNCT) experimental facility called D-BNCT01 has been recently completed and is currently able to generate a high-intensity neutron beam for BNCT-related research. In this study, we perform several experiments involving water phantoms to validate the Monte Carlo simulation results and analyze the neutron beam characteristics. According to our measurements, D-BNCT01 may generate a neutron flux of about 1.2×10⁸ n/cm²/s at the beam port using a 5 kW proton beam. Our results also show that the thermal neutron flux depth distribution inside the water phantom is in good agreement with simulations. We conclude that D-BNCT01 may be effectively employed for BNCT research.
Keywords: Neutron beam; Boron Neutron Capture Therapy; Water phantom
1. Introduction
Boron Neutron Capture Therapy (BNCT) is an advanced therapeutic modality where a boron agent is administered to the patient, and the boron accumulates in the tumor cells \cite{1-3}. The patient is then irradiated with neutrons having a suitable energy spectrum and intensity. Since reactor-based neutron sources have several drawbacks, accelerator-based Boron Neutron Capture Therapy (AB-BNCT) has received much attention, especially because such facilities can be installed in hospitals. In particular, many research groups have been focusing on the development of compact accelerator-based neutron sources \cite{4-6}.
In our case, we have built an experimental, accelerator-based BNCT instrument within the Spallation Neutron Source Science Center, which is called D-BNCT01. Additionally, we are developing the BNCT facility D-BNCT02, which will be installed in a hospital in the future. The proton energy of D-BNCT02 is 2.8 MeV and the beam power is 50 kW, using a lithium target. As for D-BNCT01, the neutron beam has been successfully generated using a low-current 3.5 MeV proton beam in 2019. Since then, the proton current has been gradually increased and the whole facility was eventually completed in 2020. Currently, we are performing cell and animal trials with the D-BNCT01 facility.
The Beam Shaping Assembly (BSA) is usually designed using Monte Carlo simulations. Before conducting trials on animals, however, the validity of the simulation-based design should be confirmed, and the characteristics of the neutron field should be analyzed. To this aim, several neutron monitoring and spectrum measurement techniques have been developed \cite{7-8}. However, as this device generates an epithermal neutron beam, it is difficult to measure the neutron intensity and spectrum directly. Since our main purpose is to assess the quality of the neutron field rather than developing innovative beam probing techniques, we perform measurements of the thermal neutron flux distribution using a water phantom. Moreover, neutronic measurement related to proton energy of 3.5 MeV for a BNCT facility has not been previously reported.
In this work, we employ three methods to measure the thermal neutron flux in the water phantom, including gold wire activation \cite{9}, Cu foil activation \cite{10}, and a lithium-based scintillator using a scanning system \cite{11}. In the following, we first introduce the simulation method and the measurement schemes, and then we present the results of a systematic comparison between the experimental and simulation results. Finally, we analyze the validity of the designed facility.
2. Methodology
2.1 Monte Carlo simulation
The phantom experiments are simulated using Monte Carlo methods, specifically employing the code MCNPX2.5 \cite{12}. This code is a general-purpose Monte Carlo radiation transport code that tracks nearly all particles at nearly all energies. Accordingly, the general source definition of this code is the SDEF card, and the angle-dependent energy spectrum of the neutron source term can be defined using this card (e.g., erg=fdir=…). For simulating neutron transportation accurately while saving computing time, the particle source term in the SDEF card should be considered carefully. As the neutron yield of the 3.5 MeV proton beam is 4.0×10⁻⁴ neutron/proton, the statistical precision of the neutron tally is hard to meet requirements when the simulation begins with the proton beam and sets the neutron tally in the water phantom. It is noted that the estimated relative error R is proportional to 1/√N, where N is the number of histories, and the consumed computing time T is proportional to N, which means if R=0.1 when T=1 hour, then 100 hours would be required to obtain R=0.01. Simply increasing the total number of histories to be run in the problem is inefficient. However, because producing one neutron requires nearly 40 thousand protons \cite{13}, setting a secondary neutron source term is an effective way to increase precision and save computing time when we tally the neutron flux at the terminal of the instrument. Thus, the simulation is divided into two steps.
The first step is proton beam simulation. In this step, only a cylinder made of lithium is included in the model, with diameter and thickness of 10 cm and 300 μm, respectively. This size of the lithium layer is nearly consistent with the actual lithium target structure. The proton beam is perpendicular to the lithium surface, and the divergence of this beam is not considered in this case. It is noted that the cross-section library used for protons reacting with lithium is from endf70prot of ENDF/VII \cite{14-15}. However, the accuracy of these cross-sections for the proton energy of 3.5 MeV should be validated by further experiment. As for neutron tally in this step, the F1 tally card of the MCNPX2.5 code is used. It is noted that the energy spectra of neutrons emitted from the lithium layer are quite different at different emission angles. Generally, the average energy of neutrons emitted in the proton beam direction is relatively higher. Thus, when obtaining the neutronic information of neutrons emitted from the lithium layer, the neutron spectra of different angles are tallied by using the c card and e card simultaneously.
The second step is to set the neutron source term in MCNPX2.5 for obtaining the neutron flux in the water phantom. Similarly, according to the tallied result of the first step, the related neutron source term can be defined. It is noted that the angle-dependent neutron spectra are considered in this secondary neutron source term. Importantly, in this step, the geometry used for the simulation is close to the real structure of the facility, which is shown in Fig.1. Obviously, using a reasonable neutron source instead of the proton source as the start particle for the actual model simulation can obtain high-precision results with less computing time.
The BSA material and configuration are truthfully modeled in the simulation. The moderator materials are Fluental and Al, and the reflector material is Pb. The collimator material is lithiated polyethylene. As the target system will influence the terminal neutron result and its structure is relatively complex, we should establish a reasonable geometric model without losing simplicity. In the simulation of the second step, the target system is made of three layers: the lithium layer, the copper layer, and the mixed copper-water layer. The refrigeration contains water, which is an important material for neutron transportation as hydrogen can effectively moderate neutrons. This structure should be considered in the model. However, as the configuration of the refrigeration is complicated and some tiny components have little influence on neutron transportation, we use the mixed copper-water layer to model this structure. The atomic compositions of copper and water are nearly the same as the realistic structure. For the same reason, the inlet and outlet pipes are also included in the model. Additionally, note that the shielding configuration is not included in our simulations because the shielding has less influence on the water phantom. In fact, it just absorbs unnecessary neutrons. Including the shielding structure into the model would require effective variance reduction techniques, which is unimportant for our purpose.
2.2 Water phantom
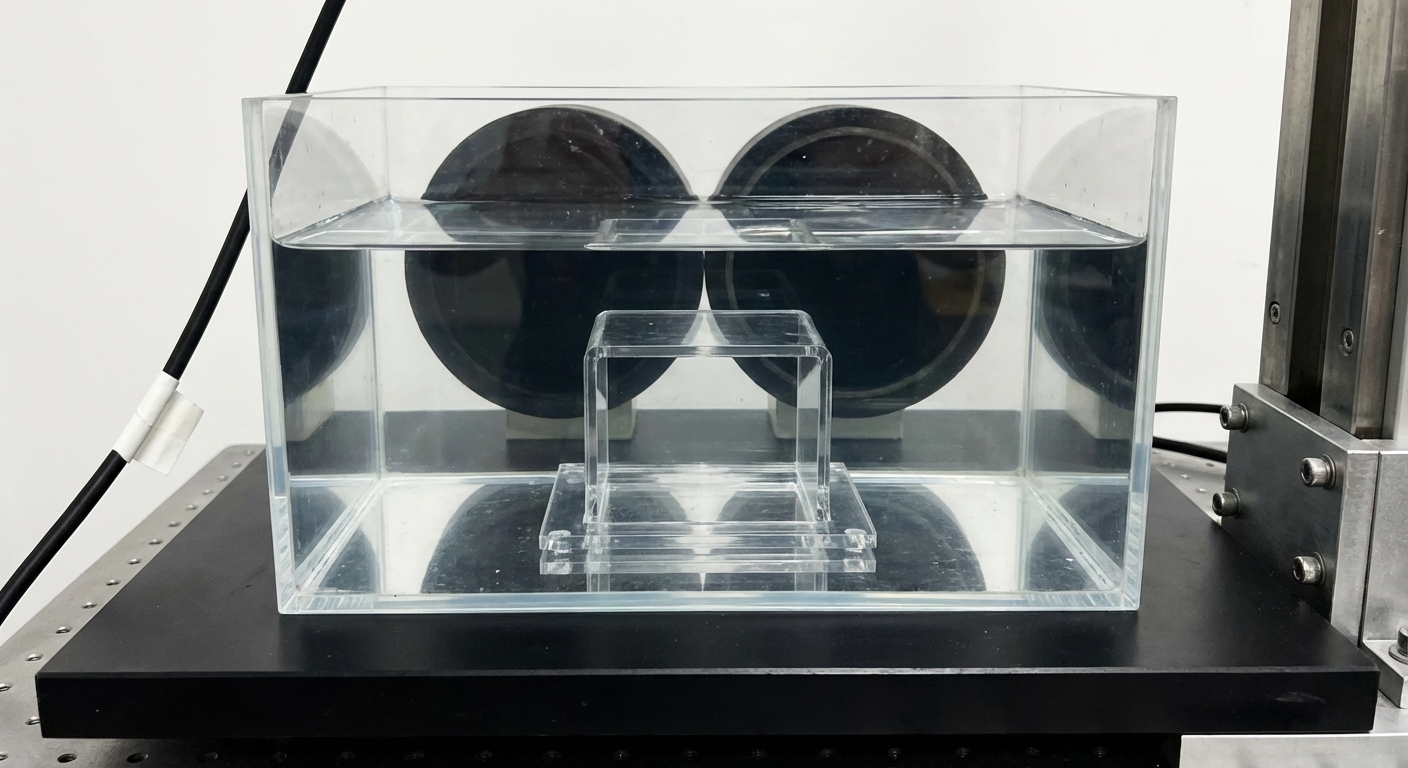
The following irradiation measurements employ a water phantom with walls made of polymethyl methacrylate (PMMA) with dimensions of 200 mm × 200 mm × 200 mm. The thickness of the phantom wall at the front side is 2 mm, and that on the other sides is 5 mm. The phantom is filled with deionized water. During the experiment, the phantom is placed close to the beam port, and the center of the phantom is positioned consistently. The experimental setup is shown in Fig. 2.
2.3 Gold wire activation measurement
We use the activation method based on gold wire (Au purity: >99.99%) in this study to measure the thermal neutron flux distribution along the beam direction \cite{9}. The length of the gold wire is 200 mm and its diameter is 0.5 mm. Since epithermal neutrons contribute to gold activation, the cadmium (Cd) difference method is applied for determining the thermal neutron flux at different positions. Firstly, the gold wire placed inside the water phantom is irradiated by the neutron beam for two hours. Secondly, the gold wire covered with a cadmium tube (inner diameter 1 mm, Cd purity: 99.95%) is irradiated for five hours. The wall thickness of the cadmium tube is 0.5 mm, which can effectively absorb thermal neutrons. The selected irradiation times guarantee that the counting rate of each gold wire piece's radioactivity is high enough, making the measurement time suitable. After neutron beam irradiation, each gold wire was cut into 5 mm pieces and weighed.
Subsequently, the radioactivity of each gold wire fragment is measured by a fully characterized High Purity Germanium (HPGe, GMX45 series by ORTEC) detector. The self-absorption correction coefficient of gold wire is 0.96. The initial calibration of the HPGe sensitivity was carried out using five point-like radionuclide photon sources instead of gold wire, including ²⁴¹Am, ¹³⁷Cs, ⁶⁰Co, ¹³³Ba, and ¹⁵²Eu. For each reference source, the confidence limits of the total error in determining the activity are less than 2%. In the gamma measurement procedure, the distance between the gold wire and the surface of the HPGe is about 15 cm, and the error from the shape difference between gold wire and point-like sources was estimated to be less than 1% by simulations.
The details of the estimation procedure for the thermal neutron flux from the HPGe data are described below. First, the saturated reaction rates for each ¹⁹⁷Au atom without cadmium and with cadmium are calculated, which estimate the reaction rates between neutrons and ¹⁹⁷Au for gold wire without cadmium and gold wire covered with cadmium. The formula for calculating this saturated reaction rate is shown in Eq. (1) \cite{14}, where R denotes the saturated reaction rate, is the average cross-section of the ¹⁹⁷Au neutron capture reaction, Φ is the neutron flux at the gold wire piece under consideration, I denotes the number of protons per unit time during irradiation, C is the net area of the full energy peak of the gold wire segment from the HPGe data, λ is the decay constant of ¹⁹⁸Au, ε is the detection efficiency of the HPGe, η is the branching ratio of ¹⁹⁸Au gamma rays, N is the total number of atoms in the gold wire segment, tirr is the total irradiation time, tc is the cooling time of the gold wire, and tm is the detection time of the HPGe.
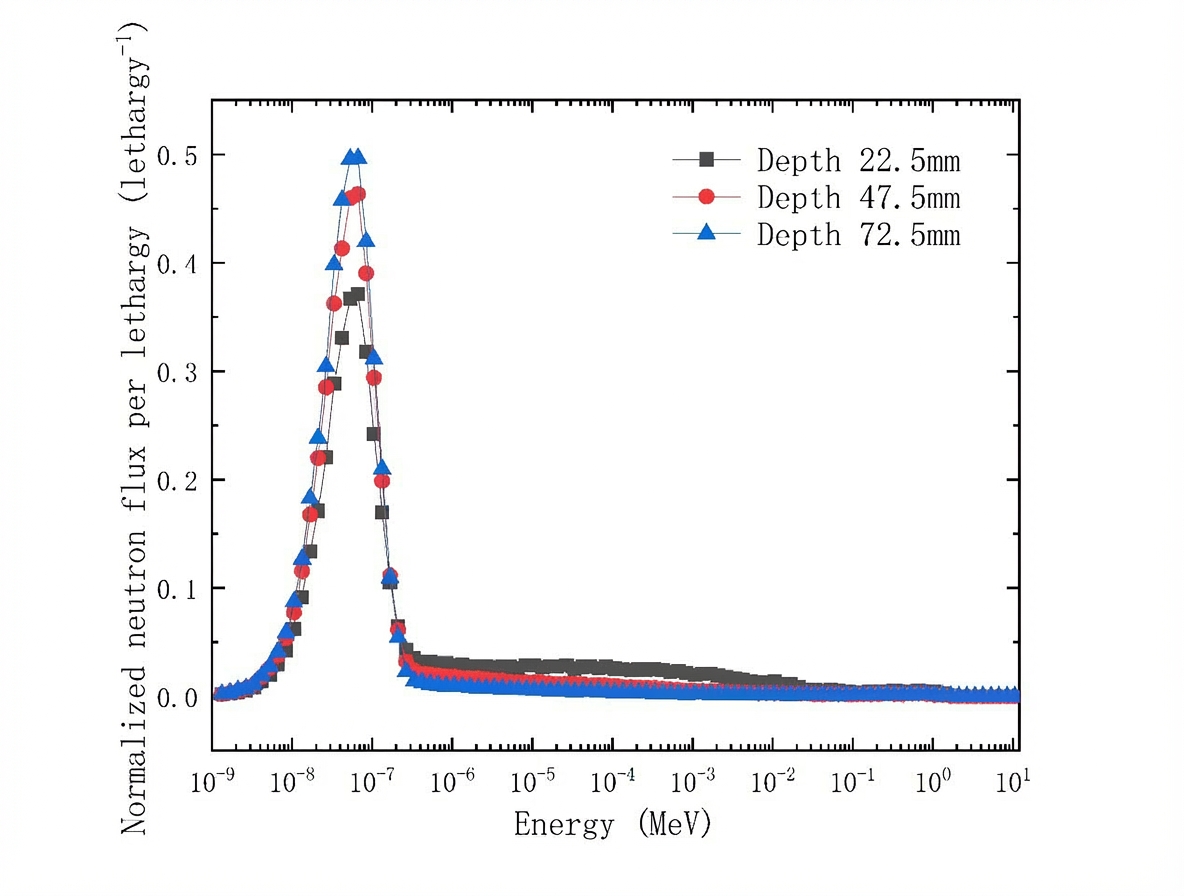
Figure 3 shows the normalized neutron spectrum at different depths in the water, and Fig.4 shows the saturated reaction rate versus depth in water for bare gold wire and gold wire covered with Cd. As the main function of Cd is to absorb thermal neutrons due to its large thermal neutron capture cross-section (2477×10⁻²⁴ cm² for natural Cd according to IRDFF \cite{15,16}), the saturated reaction rate of gold wire with Cd is related to the contribution of epithermal neutrons. From Fig.3, thermal neutrons are dominant, and the thermal neutron ratio increases as the depth inside water increases. From Fig.4, the saturated reaction rate of bare gold wire is larger than that of gold wire covered with Cd. Particularly, the maximum saturated reaction rate of bare gold wire is approximately five times higher than that with Cd. Thus, from the above analysis, the contribution to gold wire activation mainly comes from thermal neutrons. However, for attaining more accurate results of thermal neutron flux depth distribution, the epithermal neutron contribution cannot be neglected, and gold wire with Cd is still included in the measurement.
Secondly, the thermal neutron flux at a specific position can be calculated using Eq.(2) \cite{14}. It is noted that Φ/I is the saturated reaction rate of the two situations described above, and is the average thermal neutron absorption cross-section of ¹⁹⁷Au. This average cross-section is calculated by Eq.(3), where the neutron spectrum used in Eq. (3) is obtained by Monte Carlo simulation and the cross-section data is taken from Ref. \cite{15} related to Au.
2.4 Indirect neutron radiography by Cu foil
In order to measure the 2D profile distribution of the neutron beam, we use indirect neutron radiography based on a Cu sheet converter \cite{10, 17}. The principles of this method may be summarized as follows.
A copper sheet was chosen as the activation material due to its low cost, good mechanical properties, moderate thermal neutron capture cross-section, and ideal half-life of the reaction products. There are two natural isotopes in copper, with abundances of 69.2% and 30.8% for ⁶³Cu and ⁶⁵Cu, respectively. Because the half-life of the ⁶⁶Cu product is around 5 minutes, mainly releasing a gamma ray with energy of 1039 keV and branching ratio of 7%, the chief contribution to gamma-activity of the irradiated copper sheet is regarded as coming from the ⁶³Cu(n, γ)⁶⁴Cu reaction.
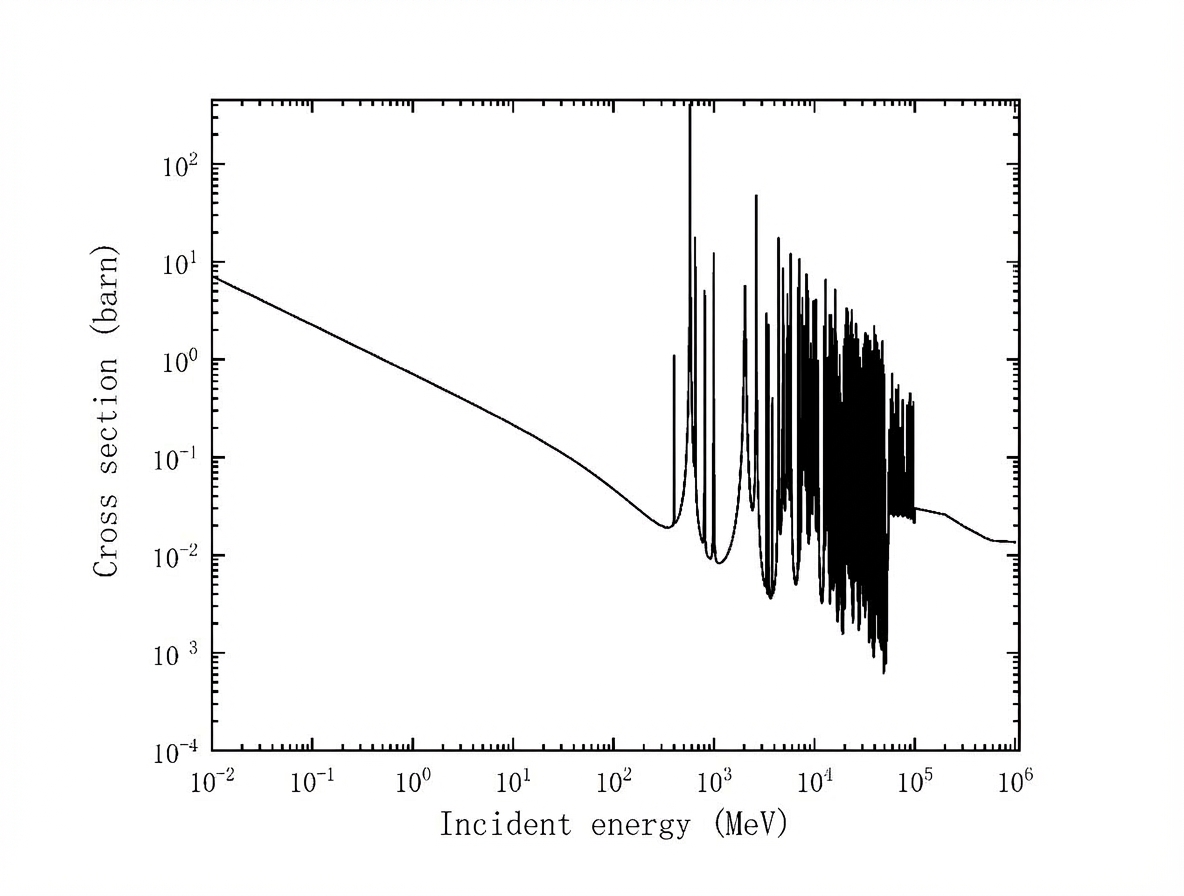
Figure 5 shows the absorption cross-section of ⁶³Cu (taken from ENDF/B-VII \cite{15}), which demonstrates that its resonance peak to neutrons is basically from several hundred eV to 100 keV. The neutron flux in this energy region inside the water phantom can be considered negligible due to the moderating effect of hydrogen in water. Thus, the total activation can be regarded as contributed by thermal neutrons. The size of the Cu sheet is 190 mm × 190 mm × 5 mm and the area of the Imaging Plate is 200 mm × 200 mm. Since the thickness of the Cu is very small compared with the mean free path of thermal neutrons in Cu, the perturbation of the Cu sheet to the neutron field may be neglected.
The radioactivity at different positions on the Cu sheet is proportional to the thermal flux at that position. Thus, measuring the spatial radioactivity distribution of the Cu sheet provides information about the 2D thermal neutron flux distribution. We use a film-like Imaging Plate (BAS-MS manufactured by Fujifilm) to measure the gamma intensity distribution from the Cu sheets \cite{10}. The principle of Imaging Plate detection is based on the "photostimulated luminescence" (PSL) phenomenon. The Imaging Plate is a flexible image sensor in which very small crystals of photo-stimulable phosphor of barium fluorobromide containing a trace amount of bivalent europium as a luminescence center, formulated as BaFBr: Eu²⁺, are uniformly coated on a polyester support film. When the Imaging Plate is exposed to radiation such as gamma rays, these phosphors can trap and store radiation energy. Based on the PSL phenomenon, this substance can emit light again upon second stimulation by light having a longer wavelength than the wavelength of the first stimulation by gamma radiation. Thus, the exposed Imaging Plate can be scanned with a laser beam of red light, releasing the stored information as light that is collected into a photomultiplier tube (PMT) and converted to electric signals. Based on this description, after irradiation the Cu sheet is stuck tightly to the Imaging Plate, which is read out by a Typhoon FLA 7000 (manufactured by GE), providing the 2D intensity distribution.
2.5 Scintillator detector with scanning system
The measuring system involving a scintillator detector consists of the following components \cite{11}: a three-axis scanning platform, a natural lithium glass scintillator, an optical fiber, a silicon photomultiplier (SiPM), an electronics system, and data acquisition software, as shown in Fig.6.
The principle of the device can be described as follows. The BNCT facility generates neutrons that are incident into the water phantom, and after gradual moderation, capture reactions occur with ⁶Li in the lithium glass scintillator. The reaction releases charged particles that excite the materials in the scintillator, causing it to emit scintillation light. This light is converted into an amplified electrical signal by the SiPM. The signal is processed by the electronics system and the data acquisition system.
As the neutron flux output from the facility is generally high, reaching the level of 1×10⁸ n/cm²/s, the pulse pile-up effect due to high thermal neutron intensity inside the water phantom should be avoided. The lithium glass scintillator was cut to a size of 1 mm × 1 mm × 1 mm for this study. The small detector size reduces the quantity of ⁶Li atoms and decreases the thermal detection efficiency of the scintillator. Besides, the small size design also provides better spatial resolution for the measuring device and further reduces sensitivity to gamma rays. Moreover, scintillators with the natural abundance of ⁶Li (7.5%) are selected, which can further reduce detection efficiency and ensure that the neutron detector operates in normal pulse mode.
Since the scintillator is placed in the water phantom, to avoid short circuits in the electric device and performance reduction caused by irradiation effects from the high-intensity neutron beam, an optical fiber with a length of about 2 m was coupled at the back end of the scintillator. The scintillation light is transmitted to the outside of the water phantom for optical signal processing.
When the optical fiber is connected to a photoelectric conversion device, the scintillating light signal is converted to an electrical signal. Conventional photomultipliers usually have a large front window area and require high-voltage power of about 1 kV. As the cross-sectional area of the optical fiber coupled with a small-size scintillator is relatively small, conventional photomultipliers are not suitable in this case. In contrast, the silicon photomultiplier (SiPM) has advantages of compact structure, small volume, large gain, low operating voltage, and fast time response \cite{18, 19}. Thus, we selected it as the photoelectric conversion device, which reduces the overall size of the measuring system and improves portability.
The SiPM output signals are sent to the electronic system for filtering, shaping, and amplification. This electronic system includes the pre-amplifier, linear amplifier, amplitude discriminator, and ADC. The data acquisition software can receive, unpack, analyze, reconstruct, and save the neutron event data uploaded by the electronics. Moreover, the scintillator is attached to the scanning pole, which is driven by a stepping motor, to obtain the thermal neutron flux at any position in the water phantom. The motion of the scanning system can be controlled remotely by computer. Finally, the whole system described above can achieve real-time measurement of the thermal neutron flux distribution inside the water phantom.
3.1 Thermal neutron flux depth distribution
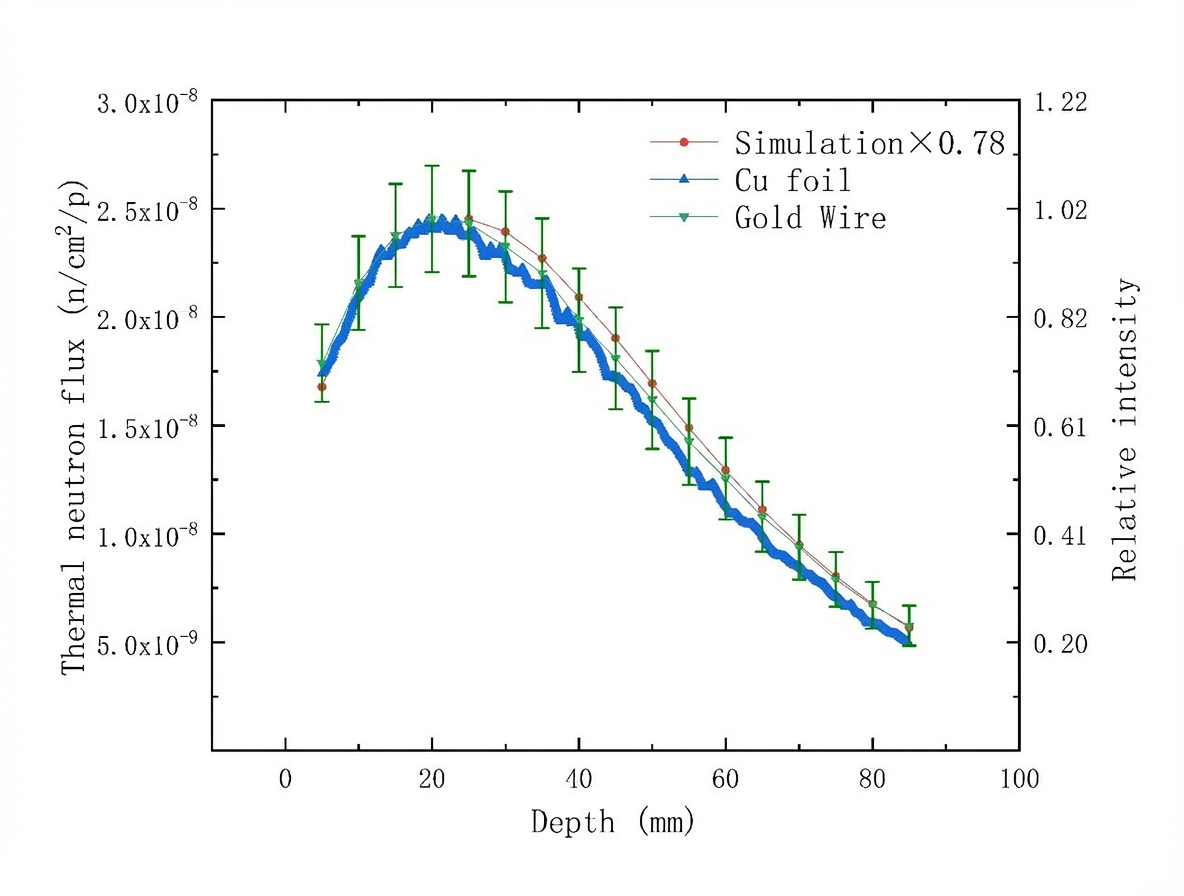
Figure 7 shows the thermal neutron flux depth distributions measured by gold wire and Cu foil compared to the Monte Carlo simulated distribution. Note that the thermal neutron flux depth distribution of the Cu foil is extracted along the depth direction from the two-dimensional distribution data. It is noted that the Cu activation method is a relative measurement rather than an absolute measurement, with the corresponding y-axis for the Cu result shown on the right of Fig. 7. The errors of the gold wire measurements are about ±10%. The simulated data have been multiplied by a normalization factor of 0.78 (ratio between the peak value for the neutron flux obtained from measurement and the peak value obtained from simulation), and after this correction, the thermal neutron flux depth distribution results from measurements and simulations are in good agreement.
Results from simulation and Cu foil measurements are basically consistent. However, the peak value of the Cu curve is at 20 mm, while the peak value of the simulation result is at 24 mm. At the same time, the tail of the Cu foil method is slightly lower than that of the simulation. The Cu foil we used is a little out of shape and is not completely smooth when placed in the water, resulting in the center line of the Cu foil not being consistent with the center line of the water phantom.
Since the thermal neutron flux depth distribution in the water phantom is related to the neutron energy spectrum from the beam port, the good agreement between the simulated and measured curves shows that the beam energy spectrum of the facility is consistent with the expected one. However, the actual spectrum at the beam port should be investigated in more detail.
For obtaining the actual spectrum of the beam port, neutron measurement without a water phantom should be performed. Currently, it is difficult to carry out measurement of the neutron spectrum across the full energy range with high accuracy \cite{9}. The space of the D-BNCT01 irradiation room is limited, which means using the neutron time-of-flight method is difficult to achieve high energy resolution. Meanwhile, using multi-foil activation and Bonner sphere spectrometry can roughly estimate the neutron flux in different energy regions, but measuring the neutron spectrum with high energy resolution should be investigated further.
The above result from the water phantom shows that the distribution of measured results is consistent with the simulation result, which means the deviation between the actual neutron spectrum and simulated neutron spectrum at the entrance is small. Thus, considering that the final purpose of BNCT is to irradiate patients, the good agreement of the thermal neutron flux depth distribution in the water phantom between measurement and simulation means the neutron spectrum generated by this facility is in line with expectations and suitable for conducting biological experiments.
As mentioned above, the agreement between simulated and measured results is obtained using a normalization factor of 0.78 for the simulated data. The main deviation in absolute neutron flux between measurement and simulation is due to the inaccuracy of the endfprot70 cross-section of the ENDF/VII library. The deviation between the simulated BSA model and practical BSA structure also influences the above result. However, it is hard to describe the complete realistic structure of the facility in the model, especially for some tiny structures and interstices between different components, which will also influence neutron transportation in the facility. At the current stage, it is difficult to obtain precise simulation results by revising the double differential cross-section of ⁷Li(p,n)⁷Be and including the complete structure in the simulation model.
However, it is noted that this normalization factor is not fixed for the facility. Because the lithium target will deteriorate and become depleted \cite{20, 21} during long-term proton beam irradiation, the neutron yield of the lithium target will change as the running time increases. Meanwhile, when the lithium target is replaced, the neutron yield may also change. As the required irradiation time should be accurately evaluated when performing cell and animal experiments, the normalization factor should be corrected as the condition of the lithium target changes.
Thus, it is recommended that phantom experiments should be conducted periodically to confirm the normalization factor, which is necessary before conducting biological experiments.
Importantly, according to the simulation result of the neutron flux at the beam port and in the water phantom, we can deduce the neutron flux at the beam port from the maximum thermal neutron flux of the gold wire measurement and the normalization factor. The neutron flux at the beam port is 1.2×10⁸ n/cm²/s under a 5 kW proton beam. As the BSA of D-BNCT01 is designed for generating epithermal neutrons, direct epithermal neutron flux measurement at the beam port should be investigated in the future.
3.2 Result of Cu foil detection
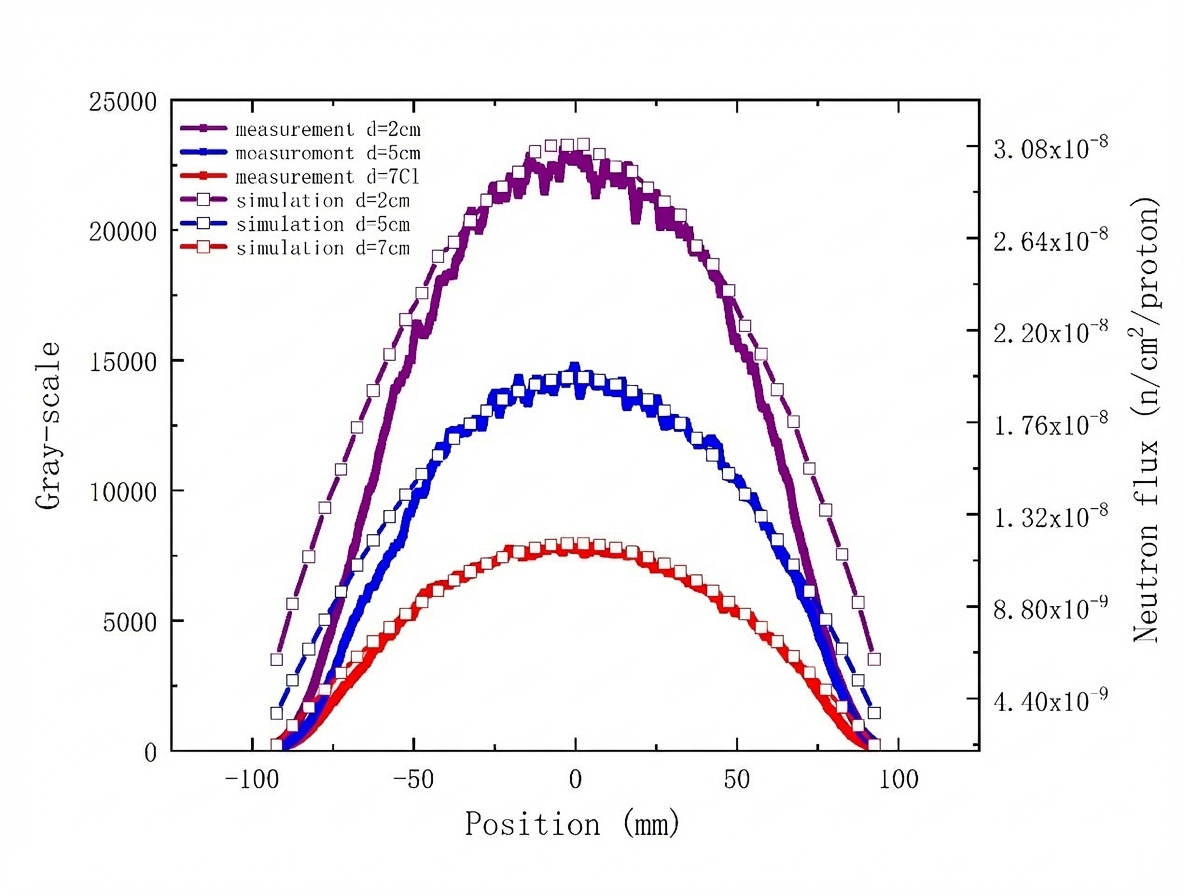
Figure 8(a) shows the two-dimensional image intensity of the Cu sheet in the water phantom. As described above, the intensity distribution of this image can reflect the relative two-dimensional thermal neutron flux distribution in the water phantom. It is noted that the black area in Fig.8(a) is the inactive area.
The lateral thermal neutron flux distribution is basically symmetrical along the green line indicated in Fig.8(a). However, because of the inhomogeneity of the Cu density and small deformation of the Cu foil, perfect symmetry of the image is hard to obtain. Moreover, according to Fig.7 and Fig.8(a), the maximum thermal neutron flux is not at the front edge of the Cu foil. The position of the maximum thermal neutron flux is about 25 mm depth in the water phantom. This is reasonable because the neutron beam generated by this facility is an epithermal neutron beam. Thus, the epithermal neutron is moderated by the front area of the water phantom, resulting in the maximum thermal neutron flux being located at a deeper position, which is beneficial for treating deeper tumors.
At the same time, Fig.8(b) shows the lateral thermal neutron distribution along three directions at different depths indicated in Fig.8(a). The depths of the "1" line, "2" line, and "3" line in Fig.8(a) are 2 cm, 5 cm, and 7 cm, respectively. The simulation results are also shown in Fig.8(b), indicated as curves with hollow squares. When considering positions between about -50 mm to 50 mm, the simulation results shown in Fig.8(b) are consistent with the measured results. However, the simulation results are higher than measurements in the margin area, with this deviation becoming more obvious closer to the edge. As the area of the Imaging Plate is close to that of the Cu foil, the above result shows that the response of the margin in the Imaging Plate we used is lower than that of its center, meaning the gamma-ray detection efficiency of the Imaging Plate used in this experiment differs among different regions, especially in the margin area.
3.3 Result of scintillator detection
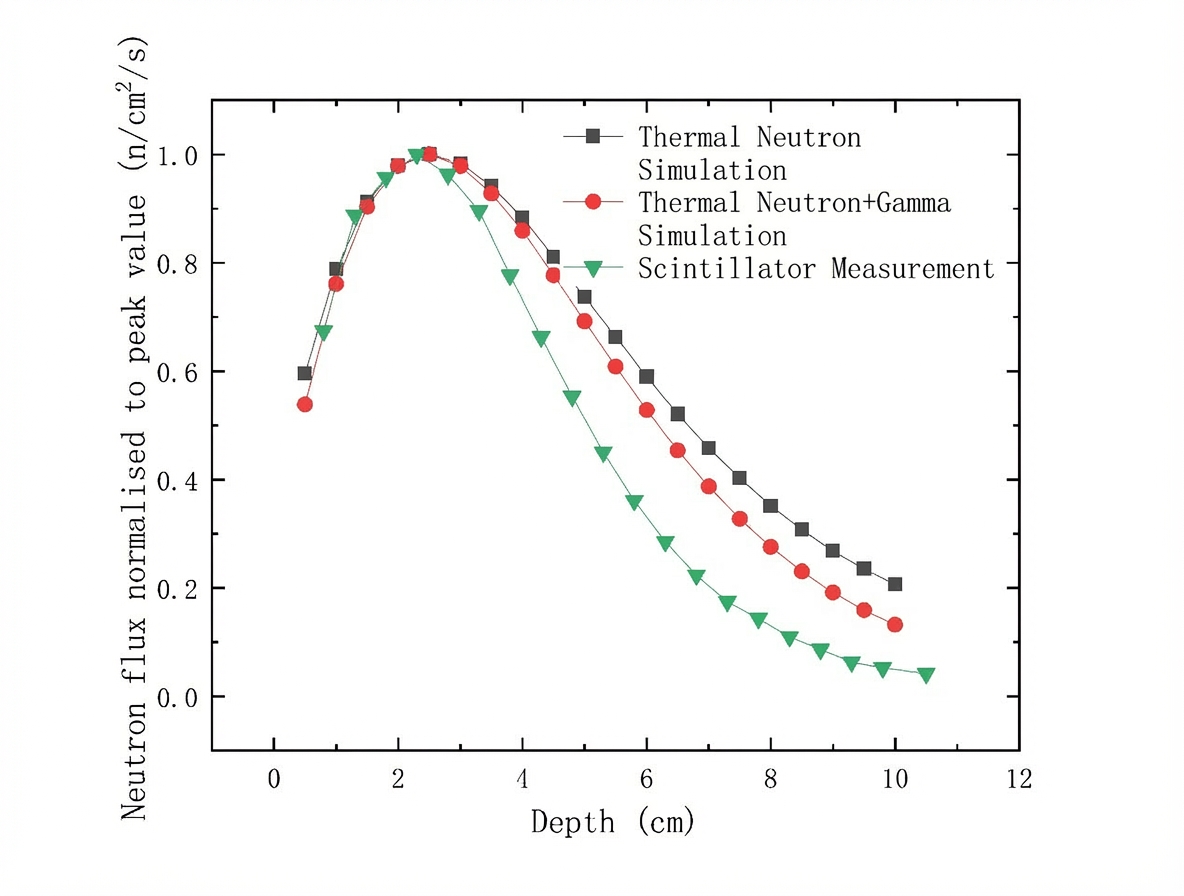
As for the result of the scanning scintillator, Fig.9 shows the results from the scintillator and simulation. The three curves are normalized to peak value. However, we can see that the scintillator result is inconsistent with the simulation result. The scintillator curve is slimmer, and the relative intensity at larger depth is smaller. The gray line denotes the thermal neutron flux distribution, and the red line denotes the sum of fluxes from neutrons and gammas. The red curve is also slimmer than the gray one. It may be argued that the scintillator used in this research responds not only to neutrons but also to gamma rays. Although gamma elimination is implemented by setting a detection threshold, the reaction rate of (n,γ) is significantly high because the thermal neutron flux is high in the water phantom. More gamma rays are released, which leads to the curve being "slimmer" after normalization to its peak value. Thus, for obtaining more accurate results from the scintillator, procedures for further reducing the gamma background should be investigated in the future.
4. Conclusion
An AB-BNCT instrument has been developed by the China Spallation Neutron Source team, referred to as D-BNCT01. The device is capable of generating high-intensity neutron beams. In this study, several experiments and measurements have been conducted to evaluate the neutron beam characteristics of D-BNCT01. In particular, we have performed measurements on a water phantom using gold wire activation, Cu foil activation, and a scanning scintillator based on optical fibers to measure the thermal neutron flux distribution. The relative thermal neutron distribution along the depth direction, as measured by gold wire and Cu foil activation, is in good agreement with simulation results. A factor of 0.78 should be used to correct the simulation result for absolute neutron flux. The neutron flux (using a 5 kW proton beam) at the beam port is estimated to be 1.2×10⁸ n/cm²/s.
The two-dimensional thermal neutron flux distribution can also be measured using Cu foil activation, and results are consistent with Monte Carlo simulations between -50 mm to 50 mm. However, the thermal neutron distribution measured by scanning scintillator should be investigated further to eliminate gamma-ray influence. Overall, in this paper, the current characteristics of the neutron beam at the D-BNCT01 facility are evaluated, and the instrument is being used to conduct cell and animal irradiation experiments.
Author contributions
All authors contributed to the study conception and design. Material preparation, data collection and analysis were performed by Jun-Yang Chen, Jian-Fei Tong, Zhi-Liang Hu, Xue-Fen Han, Bin Tang, Qian Yu, Rui-Qiang Zhang, Chong-Guang Zhao, Jun Xu, Shi-Nian Fu, Bin Zhou and Tian-Jiao Liang. The first draft of the manuscript was written by Jun-Yang Chen and all authors commented on previous versions of the manuscript. All authors read and approved the final manuscript.
Funding
This work was supported by the Program for Guangdong Introducing Innovative and Entrepreneurial Teams (2017ZT07S225), the Institute of High Energy Physics Xie-Jialin Foundation (Grant No. Y95461F) and the National Natural Science Foundation of China (Grant No. U1932219).
References
\bibitem{1} M. Wang, Y. Tong, Q. Luo et al., Study of ATP borate ester effects on cell sensitization to radiation emitted by a nuclear reactor. Nucl. Sci. Tech. 31, 2 (2020). doi: 10.1007/s41365-019-
\bibitem{2} R.F. Barth, J.A. Coderre, M.G.H. Vicente et al., Boron neutron capture therapy of cancer: Current status and future prospects. Clin. Cancer Res. 11, 3987 (2005). doi: 10.1158/1078-0432.Ccr-05-0035
\bibitem{3} H. Hatanaka, Clinical results of boron neutron capture therapy. Basic Life Sci. 54, 15 (1990).
\bibitem{4} D.A. Allen, T.D. Beynon, S. Green, Design for an accelerator-based orthogonal epithermal neutron beam for boron neutron capture therapy. Med. Phys. 26, 71 (1999). doi: 10.1118/1.598479
\bibitem{5} D. Cartelli, M.E. Capoulat, T.J. Bergueiro et al., Present status of accelerator-based BNCT: Focus on developments in Argentina. Appl. Radiat. Isot. 106, 18 (2015). doi: 10.1016/j.apradiso.2015.07.031
\bibitem{6} C. Ceballos, J. Esposito, S. Agosteo et al., Towards the final BSA modeling for the accelerator-driven BNCT facility at INFN LNL. Appl. Radiat. Isot. 69, 1660 (2011). doi: 10.1016/j.apradiso.2011.01.032
\bibitem{7} T.A. Bykov, D.A. Kasatov, A.M. Koshkarev et al., A multichannel neutron flux monitoring system for a boron neutron capture therapy facility. J. Instrum. 14, P12002 (2019). doi: 10.1088/1748-0221/14/12/p12002
\bibitem{8} M. Kim, B.H. Hong, I. Cho et al., Design of a scintillator-based prompt gamma camera for boron-neutron capture therapy: Comparison of SrI2 and GAGG using Monte-Carlo simulation. Nucl. Eng. Technol. 53, 626 (2021). doi: 10.1016/j.net.2020.07.010
\bibitem{9} H. Kumada, K. Takada, S. Tanaka et al., Evaluation of the characteristics of the neutron beam of a linac-based neutron source for boron neutron capture therapy. Appl. Radiat. Isot. 165, 109246 (2020). doi: 10.1016/j.apradiso.2020.109246
\bibitem{10} P.E. Tsai, Y.H. Liu, H.M. Liu et al., Characterization of a BNCT beam using neutron activation and indirect neutron radiography. Radiat. Meas. 45, 1167 (2010). doi: 10.1016/j.radmeas.2010.07.008
\bibitem{11} A. Ishikawa, A. Yamazaki, K. Watanabe et al., A comparison between simulation and experimental results for depth profile of Li-6 reaction rate in a water phantom of BNCT using a small Li-6-based scintillator neutron detector with an optical fiber. Radiat. Meas. 133, 106270 (2020). doi: 10.1016/j.radmeas.2020.106270
\bibitem{12} L.S. Waters, G.W. McKinney, J.W. Durkee et al., The MCNPX Monte Carol radiation transport code, Paper presented at the Hadronic Shower Simulation Workshop (Batavia, IL, 6-8 Sep. 2007)
\bibitem{13} H. Liskien, A. Paulsen, Neutron production cross sections and energies for the reactions 7Li (p, n) 7Be and 7Li (p, n) 7Be∗. At. Data Nucl. Data Tables. 15, 57 (1975). doi: 10.1016/0092-640X(75)90004-2
\bibitem{14} G.F. Knoll, Radiation detection and measurement, 4th edn. (John Wiley & Sons Inc., New Jersey, 2010), pp. 767-774
\bibitem{15} M.B. Chadwick, M. Herman, P. Oblozinsky et al., ENDF/B-VII.1 nuclear data for science and technology: cross sections, covariances, fission product yields and decay data. Nucl. Data Sheets 112, 2887 (2011). doi: 10.1016/j.nds.2011.11.002
\bibitem{16} A. Trkov, P.J. Griffin, S.P. Simakov et al., IRDFF-II: A new neutron metrology library. Nucl. Data Sheets 163, 1 (2020). doi: 10.1016/j.nds.2019.12.001
\bibitem{17} Y.H. Liu, C.K. Huang, P.E. Tsai et al., BNCT epithermal neutron beam mapping by using indirect neutron radiography. Nucl. Technol. 168, 354 (2009). doi: 10.13182/nt09-a9208
\bibitem{18} F. Acerbi, S. Gundacker, Understanding and simulating SiPMs. Nucl. Instrum. Methods Phys. Res. A 926, 16 (2019). doi: 10.1016/j.nima.2018.11.118
\bibitem{19} P.P. Calo, F. Ciciriello, S. Petrignani et al., SiPM readout electronics. Nucl. Instrum. Methods Phys. Res. A 926, 57 (2019). doi: 10.1016/j.nima.2018.09.030
\bibitem{20} S. Nakamura, H. Igaki, M. Ito et al., Neutron flux evaluation model provided in the accelerator-based boron neutron capture therapy system employing a solid-state lithium target. Sci. Rep. 11, 8090 (2021). doi: 10.1038/s41598-021-87627-8
\bibitem{21} S. Nakamura, H. Igaki, M. Ito et al., Characterization of the relationship between neutron production and thermal load on a target material in an accelerator-based boron neutron capture therapy system employing a solid-state Li target. PLoS One 14, e0225587 (2019). doi: 10.1371/journal.pone.0225587
Translated Figures